Advertisements
Advertisements
प्रश्न
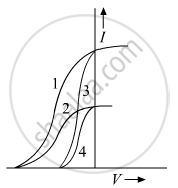
The given graph shows the variation of photo-electric current (I) versus applied voltage (V) for two difference photosensitive materials and for two different intensities of the incident radiations. Identify the pairs of curves that correspond to different materials but same intensity of incident radiation.

उत्तर
Curves 1 and 2 correspond to similar materials while curves 3 and 4 represent different materials, since the value of stopping potential for the pair of curves (1 and 2) & (3 and 4) are the same. For given frequency of the incident radiation the stopping potential is independent of its intensity.
So, the pairs of curves (1 and 3) and (2 and 4) correspond to different materials but same intensity of incident radiation.
APPEARS IN
संबंधित प्रश्न
The voltage and current in a series AC circuit are given by V = V0cos ωt and i = i0 sin ωt. What is the power dissipated in the circuit?
Can the peak voltage across the inductor be greater than the peak voltage of the source in an LCR circuit?
Can a hot-wire ammeter be used to measure a direct current of constant value? Do we have to change the graduations?
The peak power consumed by a resistive coil, when connected to an AC source, is 80 W. Find the energy consumed by the coil in 100 seconds, which is many times larger than the time period of the source.
A capacitor of capacitance 10 μF is connected to an oscillator with output voltage ε = (10 V) sin ωt. Find the peak currents in the circuit for ω = 10 s−1, 100 s−1, 500 s−1 and 1000 s−1.
A coil of inductance 5.0 mH and negligible resistance is connected to the oscillator of the previous problem. Find the peak currents in the circuit for ω = 100 s−1, 500 s−1, 1000 s−1.
A resistor of resistance 100 Ω is connected to an AC source ε = (12 V) sin (250 π s−1)t. Find the energy dissipated as heat during t = 0 to t = 1.0 ms.
Answer the following question.
A small town with a demand of 1200 kW of electric power at 220 V is situated 20 km away from an electric plant generating power at 440 V. The resistance of the two wirelines carrying power is 0.5 Ω per km. The town gets the power from the line through a 4000-220 V step-down transformer at a sub-station in the town. Estimate the line power loss in the form of heat.
The output of a step-down transformer is measured to be 24 V when connected to a 12-watt light bulb. The value of the peak current is ______.
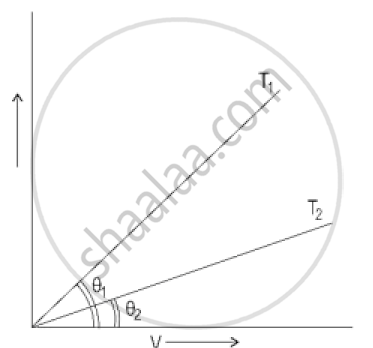
In the Figure below, the current-voltage graphs for a conductor are given at two different temperatures, T1 and T2.

- At which temperature T1 or T2 is the resistance higher?
- Which temperature (T1 or T2) is higher?
