Advertisements
Advertisements
प्रश्न
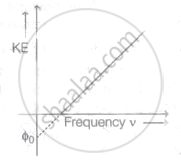
The graph of kinetic energy against the frequency v of incident light is as shown in the figure. The slope of the graph and intercept on X-axis respectively are ______.

पर्याय
maximum KE threshold frequency
Planck's constant, threshold frequency
Planck's constant, work function
work function, maximum KE
उत्तर
The graph of kinetic energy against the frequency v of incident light is as shown in the figure. The slope of the graph and intercept on X-axis respectively are planck's constant, threshold frequency.
Explanation:
For photoelectric effect,
(KE)max =hv - Φ0 ...(i)
where Φ0 is the work function of metal.
On comparing the Eq. (i) with straight line equation
y = mx + c, we get
Slope, m = h and intercept on y, c = - Φ0 and Φ0 = hv0
where, v0 is threshold frequency.
So, for the graph of kinetic energy (KE) against the frequency (v).
Slope = Planck's constant
and intercept on X-axis = threshold frequency
