Advertisements
Advertisements
प्रश्न
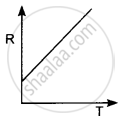
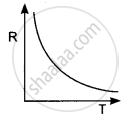
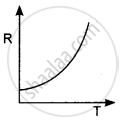
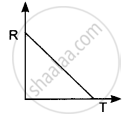
The temperature of a conductor is increased. The graph best showing the variation of its resistance is:
पर्याय
MCQ
उत्तर

Explanation:
Resistance is directly proportional to the temperature of the conductor.
shaalaa.com
या प्रश्नात किंवा उत्तरात काही त्रुटी आहे का?


