Advertisements
Advertisements
प्रश्न
Use graph paper to Solution this question.
During a medical checkup of 60 students in a school, weights were recorded as follows:
| Weight (in kg) | Number of Students (f) |
| 28 – 30 | 2 |
| 30 – 32 | 4 |
| 32 – 34 | 10 |
| 34 – 36 | 13 |
| 36 – 38 | 15 |
| 38 – 40 | 9 |
| 40 – 42 | 5 |
| 42 – 44 | 2 |
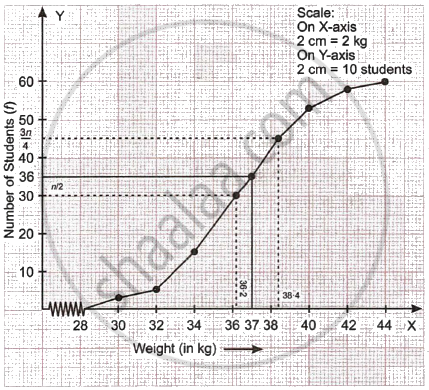
Taking 2 cm = 2 kg along one axis and 2 cm = 10 students along the other axis draw an ogive. Use your graph to find the:
- median
- upper Quartile
- number of students whose weights is above 37 kg
उत्तर
| Weight (in kg) | Number of Students (f) |
Cumulative frequency (cf) |
| 28 – 30 | 2 | 2 |
| 30 – 32 | 4 | 6 |
| 32 – 34 | 10 | 16 |
| 34 – 36 | 13 | 29 |
| 36 – 38 | 15 | 44 |
| 38 – 40 | 9 | 53 |
| 40 – 42 | 5 | 58 |
| 42 – 44 | 2 | 60 |

a. Here N = 60
∴ Median = `N/2`
= `60/2`
= 30th term
= 36.2 kg ...(From the graph)
b. Upper quartile
= `(3N)/4`
= `(3 xx 60)/4`
= 45th term
= 38.4 kg ...(From the graph)
c. Number of students whose weight in above 37 kg.
= 60 – 36
= 24 students.
APPEARS IN
संबंधित प्रश्न
The monthly income of a group of 320 employees in a company is given below:
| Monthly Income | No. of Employees |
| 6000-7000 | 20 |
| 7000-8000 | 45 |
| 8000-9000 | 65 |
| 9000-10000 | 95 |
| 10000-11000 | 60 |
| 11000-12000 | 30 |
| 12000-13000 | 5 |
Draw an ogive the given distribution on a graph sheet taking 2 cm = Rs. 1000 on one axis and 2 cm = 50 employees on the other axis. From the graph determine:
(1) the median wage
(2) the number of employees whose income is below Rs. 8500.
(3) if the salary of a senior employee is above Rs. 11,500, find the number of senior employees in the company.
(4) the upper quartile.
Use graph paper for this question.
The marks obtained by 120 students in an English test are given below :
| Marks | 0 - 10 | 10 - 20 | 20 - 30 | 30 - 40 | 40 - 50 | 50 - 60 | 60 - 70 | 70 - 80 | 80 - 90 | 90 -100 |
| No.of students | 5 | 9 | 16 |
22 |
26 | 18 |
11 |
6 | 4 | 3 |
Draw the ogive and hence, estimate:
(i) the median marks.
(ii) the number of students who did not pass the test if the pass percentage was 50.
(iii) the upper quartile marks.
Use graph paper for this question, take 2 cm = 10 marks along one axis and 2 cm = 10 students along the other axis.
The following table shows the distribution of marks in a 50 marks test in Mathematics:
| Marks | 0 - 10 | 10 - 20 | 20 - 30 | 30 - 40 | 40 - 50 |
| No. of. Students | 6 | 10 | 13 | 7 | 4 |
Draw the ogive for the above distribution and hence estimate the median marks.
A life insurance agent found the following data for distribution of ages of 100 policy holders.
| Age in years | Policy Holders (frequency) |
Cumulative frequency |
| 20 – 25 | 2 | 2 |
| 25 – 30 | 4 | 6 |
| 30 – 35 | 12 | 18 |
| 35 – 40 | 20 | 38 |
| 40 – 45 | 28 | 66 |
| 45 – 50 | 22 | 88 |
| 50 – 55 | 8 | 96 |
| 55 – 60 | 4 | 100 |
On a graph sheet draw an ogive using the given data. Take 2 cm = 5 years along one axis and 2 cm = 10 policy holders along the other axis.
Use your graph to find:
- The median age.
- Number of policy holders whose age is above 52 years.
