Advertisements
Advertisements
प्रश्न
Using hypothetical data show a market demand schedule.
उत्तर
The demand schedule summarises the information on prices and quantities demanded. It shows different quantities of a commodity demanded (per period of time) at different prices (per unit of the commodity).
| Price of Sugar ₹(per kg) | Demand by Consumer A (kg per month) | Demand by Consumer B (kg per month) | Demand by Consumer C (kg per month) | Market Demand (kg per month) A + B + C |
| 30 | 1 | 2 | 3 | 6 |
| 29 | 2 | 3 | 4 | 9 |
| 28 | 3 | 4 | 5 | 12 |
| 27 | 4 | 5 | 6 | 15 |
| 26 | 5 | 6 | 7 | 18 |
APPEARS IN
संबंधित प्रश्न
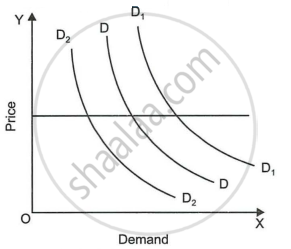
With the help of suitable diagram explain the meaning of rightward shift in the demand curve. Explain briefly any two of its determinants.
Complete the following demand schedule:
| Price (in ₹) | Quantity of mangoes demanded (in kg) |
| 350 | 2 |
| 300 | |
| 250 | |
| 200 | |
| 150 | |
| 100 |
A fall in income of the consumer (in the case of normal goods) will cause a/an ______.
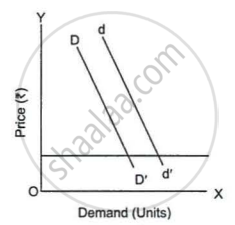
Demand curve of a good shifts from DD' to Demand dd'. This shift can be caused by:
The market demand curve is a ______ summation of all individual demand curves.
State the impact of the following changes on the demand curve of a commodity:
A rise in the price of the commodity
Shyam, Sita, Renu, Ahmed and John are five consumers of apples. Their demand for apples is given below. Derive the market demand schedule for apples.
| Price per Kg (in ₹) | Quantity Demanded (Apples) in Kg. | ||||
| Shyam | Sita | Renu | Ahmed | John | |
| 25.00 | 16 | 15 | 12 | 14 | 18 |
| 30.00 | 12 | 11 | 10 | 8 | 15 |
| 35.00 | 10 | 9 | 8 | 6 | 12 |
| 40.00 | 8 | 6 | 4 | 2 | 8 |
With the help of a hypothetical table, draw the demand curve of a commodity.
Briefly explain any three determinants for the negative slope of the demand curve.
Explain the diagram given below.