Advertisements
Advertisements
Question
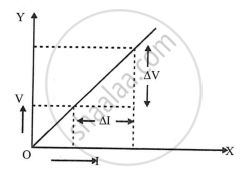
- Draw a V-I graph for a conductor obeying Ohm’s law.
- What does the slope of V–I graph for a conductor represent?
Solution
-
Use the Y-axis to plot V against I, and the X-axis to plot I. As can be seen in the illustration, the graphs are determined to be straight lines. So, the ohm law is confirmed.
APPEARS IN
RELATED QUESTIONS
Write the formula of resistivity
A resistance of 40 ohms and one of 60 ohms are arranged in series across 220 volt supply. Find the heat in joules produced by this combination of resistances in half a minute.
What is the necessary condition for a conductor to obey Ohm’s law?
In a conductor 6.25 × `10^16` electrons flow from its end A to B in 2 s. Find the current flowing through the conductor (e = 1.6 × `10^-19` C)
SI unit of resistance is:
The unit of specific resistance is ____________.
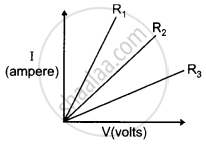
A student carries out an experiment and plots the V-I graph of three samples of nichrome wire with resistances R1, R2 and R3 respectively. Which of the following is hue?
Consider a current carrying wire (current I) in the shape of a circle. Note that as the current progresses along the wire, the direction of j (current density) changes in an exact manner, while the current I remain unaffected. The agent that is essentially responsible for is ______.
Two cells of same emf E but internal resistance r1 and r2 are connected in series to an external resistor R (Figure). What should be the value of R so that the potential difference across the terminals of the first cell becomes zero.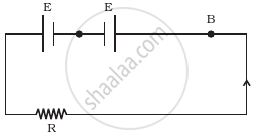
State Ohm's Law. Represent it mathematically.
