Advertisements
Advertisements
Question
Draw a curve showing density or pressure variations with respect to distance for a disturbance produced by sound. Mark the position of compression and rarefaction on this curve. Also, define wavelengths and time periods using this curve.
Solution
The points of maximum density (or pressure) and minimum density (or pressure) are also called crests and troughs respectively.
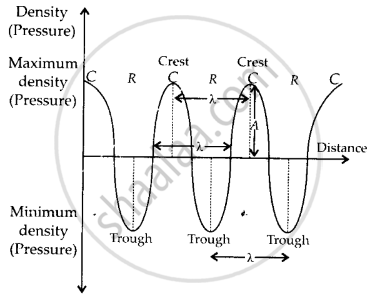
Wavelength (A): The distance between two consecutive compressions or two consecutive rarefactions is called wavelength.
Time period (T): Time period of a wave is defined as the time taken by its two consecutive compressions or rarefactions to cross a fixed point.
APPEARS IN
RELATED QUESTIONS
Fill in the blank.
________ produces a sensation in ears.
| Column A | Column B |
| (a) Vibrations cause | (1) absorb sound |
| (b) A shriller sound is | (2) second |
| (c) Unit of frequency | (3) sound |
| (d) Unit of time period | (4) of high pitch |
| (e) Curtains | (5) hertz |
Name the two characteristics of sound which differentiate two sounds from each other.
Differentiate between a high pitch sound and a low pitch sound.
How is sound perceived by us?
Vibration of object produces ______.
The sound waves are reflected from an obstacle into the same medium from which they were incident. Which of the following changes?
Name three animals, which can hear ultrasonic vibrations.
In which medium the speed of the sound is maximum?
The elastic property of medium is a factor of ______ medium.
