Advertisements
Advertisements
Question
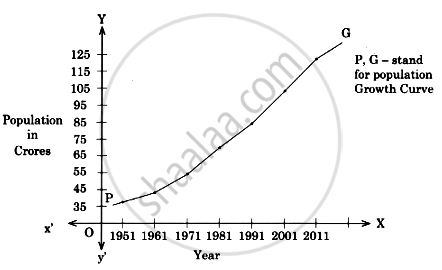
Draw a population growth curve from the given data.
| Year | Population (in Crores) |
| 1951 | 36.1 |
| 1961 | 43.9 |
| 1971 | 54.8 |
| 1981 | 68.3 |
| 1991 | 84.6 |
| 2001 | 102.7 |
| 2011 | 121.02 |
Solution

APPEARS IN
RELATED QUESTIONS
Give economic term:
Balance between natural resources and population growth.
Identify and explain the concept from the given illustration:
There were 40 births per 1000 in the country 'A' during a year.
Answer the following :
Explain the causes of the high birth rate.
What is the correlation between population growth and economic development?
Why is there great variation among various regions in doubling their population?
What was the world population at the time of the Industrial Revolution?
How many people are added to the world population every year?
What was the reason behind the population explosion happened in the Eighteenth century?
It took how many years for the world population to grow from 1 billion to 2 billion?
