Advertisements
Advertisements
Question
Draw histogram and hence the frequency polygon for the following frequency distribution:
| Rainfall (in cm) | No. of years |
| 20-25 | 2 |
| 25-30 | 5 |
| 30-35 | 8 |
| 35-40 | 12 |
| 40-45 | 10 |
| 45-50 | 7 |
Solution

APPEARS IN
RELATED QUESTIONS
For which of these would you use a histogram to show the data?
(a) The number of letters for different areas in a postman’s bag.
(b) The height of competitors in an athletics meet.
(c) The number of cassettes produced by 5 companies.
(d) The number of passengers boarding trains from 7:00 a.m. to 7:00 p.m. at a station.
Give reasons for each.
The weekly wages (in Rs) of 30 workers in a factory are.
830, 835, 890, 810, 835, 836, 869, 845, 898, 890, 820, 860, 832, 833, 855, 845, 804, 808, 812, 840, 885, 835, 835, 836, 878, 840, 868, 890, 806, 840
Using tally marks make a frequency table with intervals as 800 − 810, 810 − 820 and so on.
Draw histogram and frequency polygon on the same graph paper for the following frequency distribution
| Class | Frequency |
| 15-20 | 20 |
| 20-25 | 30 |
| 25-30 | 50 |
| 30-35 | 40 |
| 35-40 | 25 |
| 40-45 | 10 |
A Mathematics aptitude test of 50 students was recorded as follows:
| Marks | 50 - 60 | 60 - 70 | 70 - 80 | 80 - 90 | 90 – 100 |
| No. of Students | 4 | 8 | 14 | 19 | 5 |
Draw a histogram from the above data using a graph paper and locate the mode.
| Electricity bill (₹) | 0 - 200 | 200 - 400 | 400 - 600 | 600 - 800 | 800 - 1000 |
| Families | 240 | 300 | 450 | 350 | 160 |
| Result (Percentage) | 30 - 40 | 40 - 50 | 50 - 60 | 60 -70 | 70 - 80 | 80 - 90 | 90 - 100 |
| No. of students | 7 | 33 | 45 | 65 | 47 | 18 | 5 |
Given below is the frequency distribution of the heights of 50 students of a class:
| Class interval: | 140−145 | 145−150 | 150−155 | 155−160 | 160−165 |
| Frequency: | 8 | 12 | 18 | 10 | 5 |
Draw a histogram representing the above data.
Draw a histogram of the following data:
| Class interval: | 10−15 | 15−20 | 20−25 | 25−30 | 30−35 | 34−40 |
| Frequency: | 30 | 98 | 80 | 58 | 29 | 50 |
Number of workshops organized by a school in different areas during the last five years are as follows:
| Years | No. of workshops |
| 1995−1996 | 25 |
| 1996−1997 | 30 |
| 1997−1998 | 42 |
| 1998−1999 | 50 |
| 1999−2000 | 65 |
Draw a histogram representing the above data.
The following frequency distribution table shows marks obtained by 180 students in Mathematics examination.
| Marks | No. of students |
| 0 – 10 | 25 |
| 10 – 20 | x |
| 20 – 30 | 30 |
| 30 – 40 | 2x |
| 40 – 50 | 65 |
Find the value of x. Also draw a histogram representing the above information.
Draw the Histogram and hence, the frequency polygon for the following frequency distribution:
| House Rent (In ₹ per month) | 400-600 | 600-800 | 800-1000 | 1000-1200 |
| Number of families | 200 | 240 | 300 | 50 |
Distribution of height in cm of 100 people is given below:
| Class interval (cm) | Frequency |
| 145 - 155 | 3 |
| 155 - 165 | 35 |
| 165 - 175 | 25 |
| 175 - 185 | 15 |
| 185 - 195 | 20 |
| 195 - 205 | 2 |
Draw a histogram to represent the above data.
Identify the following data can be represented in a histogram?
Production of cycles in different years
Identify the following data can be represented in a histogram?
The number of votes polled from 7 am to 6 pm in an election
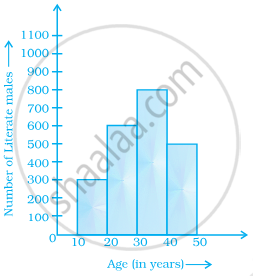
The total number of people surveyed is ______.
From the histogram given on the right, we can say that 1500 males above the age of 20 are literate.
Look at the histogram below and answer the questions that follow.
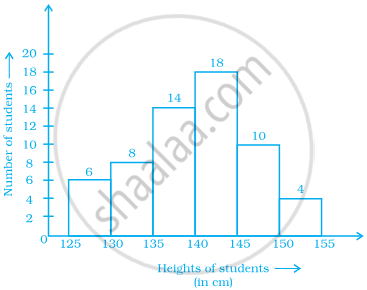
- How many students have height more than or equal to 135 cm but less than 150 cm?
- Which class interval has the least number of students?
- What is the class size?
- How many students have height less than 140 cm?
Prepare a histogram from the frequency distribution table obtained in question 93.
The following histogram shows the frequency distribution of teaching experiences of 30 teachers in various schools:

- What is the class width?
- How many teachers are having the maximum teaching experience and how many have the least teaching experience?
- How many teachers have teaching experience of 10 to 20 years?
