Topics
Compound Interest
- Compound Interest as a Repeated Simple Interest Computation with a Growing Principal
- Use of Compound Interest in Computing Amount Over a Period of 2 Or 3-years
- Use of Formula
- Finding CI from the Relation CI = A – P
GST (Goods and Services Tax)
- Sales Tax, Value Added Tax, and Good and Services Tax
- Computation of Tax
- Concept of Discount
- List Price
- Basic Concepts of Profit and Loss
- Basic/Cost Price Including Inverse Cases.
- Selling Price
- Dealer
- Goods and Service Tax (Gst)
- Gst Tax Calculation
- Input Tax Credit (Itc)
Commercial Mathematics
Algebra
Banking
Geometry
Shares and Dividends
Linear Inequations
- Linear Inequations in One Variable
- Solving Algebraically and Writing the Solution in Set Notation Form
- Representation of Solution on the Number Line
Mensuration
- Circumference of a Circle
- Surface Area of a Right Circular Cone
- Surface Area of a Sphere
- Circle - Direct Application Problems Including Inner and Outer Area
- Surface Area of a Right Circular Cone
- Surface Area of a Sphere
- Volume of a Cylinder
- Volume of a Combination of Solids
- Surface Area of Cylinder
Symmetry
Quadratic Equations
- Quadratic Equations
- Solutions of Quadratic Equations by Factorization
- Nature of Roots of a Quadratic Equation
- Equations Reducible to Quadratic Equations
Trigonometry
- Trigonometric Ratios of Complementary Angles
- Trigonometric Identities
- Heights and Distances - Solving 2-D Problems Involving Angles of Elevation and Depression Using Trigonometric Tables
- Trigonometry
Statistics
- Median of Grouped Data
- Graphical Representation of Data as Histograms
- Ogives (Cumulative Frequency Graphs)
- Concepts of Statistics
- Graphical Representation of Data as Histograms
- Graphical Representation of Ogives
- Finding the Mode from the Histogram
- Finding the Mode from the Upper Quartile
- Finding the Mode from the Lower Quartile
- Finding the Median, upper quartile, lower quartile from the Ogive
- Calculation of Lower, Upper, Inter, Semi-Inter Quartile Range
- Concept of Median
- Mean of Grouped Data
- Mean of Ungrouped Data
- Median of Ungrouped Data
- Mode of Ungrouped Data
- Mode of Grouped Data
- Mean of Continuous Distribution
Solving (Simple) Problems (Based on Quadratic Equations)
- Problems Based on Numbers
- Problems Based on Time and Work
- Problems Based on Geometrical Figures
- Problems Based on Distance, Speed and Time
- Problems on C.P. and S.P.
- Miscellaneous Problems
Ratio and Proportion
- Concept of Ratio
- Concept of Proportion
- Componendo and Dividendo Properties
- Alternendo and Invertendo Properties
- Direct Applications
Probability
Factorization
- Factor Theorem
- Remainder Theorem
- Factorising a Polynomial Completely After Obtaining One Factor by Factor Theorem
Matrices
Arithmetic Progression
- Arithmetic Progression - Finding Their General Term
- Sum of First ‘n’ Terms of an Arithmetic Progressions
- Simple Applications of Arithmetic Progression
- Arithmetic mean
- Properties of an Arithmetic Progression
Geometric Progression
- Geometric Progression - Finding Their General Term.
- Geometric Progression - Finding Sum of Their First ‘N’ Terms
- Simple Applications - Geometric Progression
Reflection
- Reflection Examples
- Reflection Concept
- Reflection of a Point in a Line
- Reflection of a Point in the Origin.
- Invariant Points.
Co-ordinate Geometry Distance and Section Formula
- Co-ordinates Expressed as (x,y)
- Distance Formula
- Section Formula
- The Mid-point of a Line Segment (Mid-point Formula)
- Points of Trisection
- Centroid of a Triangle
Co-ordinate Geometry Equation of a Line
- Slope of a Line
- Concept of Slope
- Equation of a Line
- Various Forms of Straight Lines
- General Equation of a Line
- Slope – Intercept Form
- Two - Point Form
- Geometric Understanding of ‘m’ as Slope Or Gradient Or tanθ Where θ Is the Angle the Line Makes with the Positive Direction of the x Axis
- Geometric Understanding of c as the y-intercept Or the Ordinate of the Point Where the Line Intercepts the y Axis Or the Point on the Line Where x=0
- Conditions for Two Lines to Be Parallel Or Perpendicular
- Simple Applications of All Co-ordinate Geometry.
- Collinearity of Three Points
Similarity
- Similarity of Triangles
- Axioms of Similarity of Triangles
- Areas of Similar Triangles Are Proportional to the Squares on Corresponding Sides
- Conditions for Similarity of Two Triangles: (Sas, Aa Or Aaa and Sss)
- Basic Proportionality Theorem with Applications
- Relation Between the Areas of Two Triangles
- Similarity as a Size Transformation
- Direct Applications Based on the Above Including Applications to Maps and Models
Loci
Circles
- Concept of Circle
- Areas of Sector and Segment of a Circle
- Tangent Properties - If a Line Touches a Circle and from the Point of Contact, a Chord is Drawn, the Angles Between the Tangent and the Chord Are Respectively Equal to the Angles in the Corresponding Alternate Segments
- Tangent Properties - If a Chord and a Tangent Intersect Externally, Then the Product of the Lengths of Segments of the Chord is Equal to the Square of the Length of the Tangent from the Point of Contact to the Point of Intersection
- Tangent to a Circle
- Number of Tangents from a Point on a Circle
- Chord Properties - a Straight Line Drawn from the Center of a Circle to Bisect a Chord Which is Not a Diameter is at Right Angles to the Chord
- Chord Properties - the Perpendicular to a Chord from the Center Bisects the Chord (Without Proof)
- Theorem: Equal chords of a circle are equidistant from the centre.
- Theorem : The Chords of a Circle Which Are Equidistant from the Centre Are Equal.
- Chord Properties - There is One and Only One Circle that Passes Through Three Given Points Not in a Straight Line
- Arc and Chord Properties - the Angle that an Arc of a Circle Subtends at the Center is Double that Which It Subtends at Any Point on the Remaining Part of the Circle
- Theorem: Angles in the Same Segment of a Circle Are Equal.
- Arc and Chord Properties - Angle in a Semi-circle is a Right Angle
- Arc and Chord Properties - If Two Arcs Subtend Equal Angles at the Center, They Are Equal, and Its Converse
- Arc and Chord Properties - If Two Chords Are Equal, They Cut off Equal Arcs, and Its Converse (Without Proof)
- Arc and Chord Properties - If Two Chords Intersect Internally Or Externally Then the Product of the Lengths of the Segments Are Equal
- Cyclic Properties
- Tangent Properties - If Two Circles Touch, the Point of Contact Lies on the Straight Line Joining Their Centers
Constructions
- Circumscribing and Inscribing a Circle on a Regular Hexagon
- Circumscribing and Inscribing a Circle on a Triangle
- Construction of Tangents to a Circle
- Circumference of a Circle
- Circumscribing and Inscribing Circle on a Quadrilateral
- Construction of a histogram for continuous frequency distribution
- Construction of histogram for discontinuous frequency distribution.
Definition
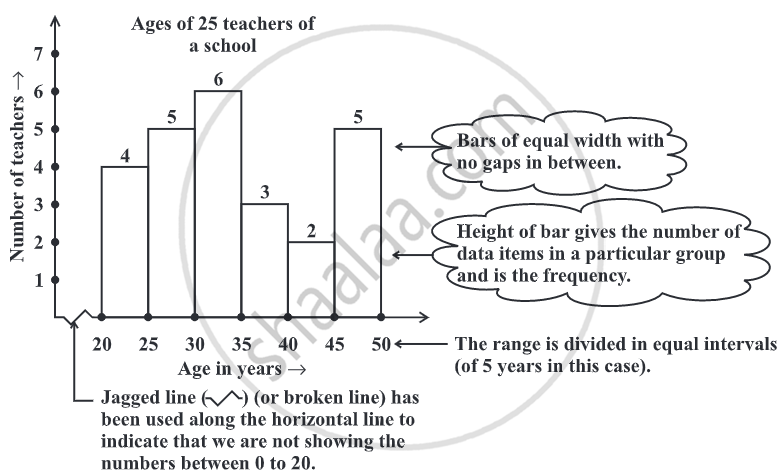
Histogram: Histogram is a type of bar diagram, where the class intervals are shown on the horizontal axis and the heights of the bars show the frequency of the class interval. Also, there is no gap between the bars as there is no gap between the class intervals.
Notes
Graphical Representation of Data as Histograms:
-
Grouped data can be presented using a histogram.
-
Histogram is a type of bar diagram, where the class intervals are shown on the horizontal axis and the heights of the bars show the frequency of the class interval. Also, there is no gap between the bars as there is no gap between the class intervals.
-
A Histogram is a bar graph that shows data in intervals. It has adjacent bars over the intervals.
-
This is a form of representation like the bar graph, but it is used for continuous class intervals.
-
There are no gaps in between consecutive rectangles, the resultant graph appears like a solid figure. This is called a histogram, which is a graphical representation of a grouped frequency distribution with continuous classes.
-
Unlike a bar graph, the width of the bar plays a significant role in its construction. The widths of the rectangles are all equal and the lengths of the rectangles are proportional to the frequencies.
Construction of Histogram:
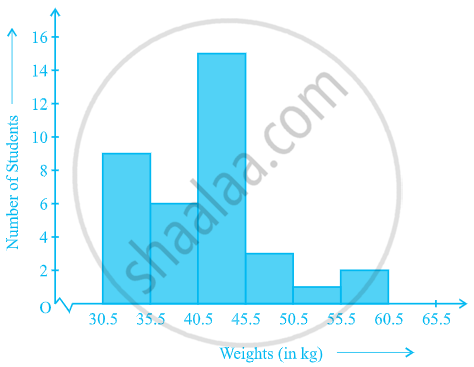
For instance, consider the frequency distribution Table, representing the weights of 36 students of a class:
| Weights (in kg) | Number of students |
| 30.5 - 35.5 | 9 |
| 35.5 - 40.5 | 6 |
| 40.5 - 45.5 | 15 |
| 45.5 - 50.5 | 3 |
| 50.5 - 55.5 | 1 |
| 55.5 - 60.5 | 2 |
| Total | 36 |
Let us represent the data given above graphically as follows:
(i) We represent the weights on the horizontal axis on a suitable scale. We can choose the scale as 1 cm = 5 kg. Also, since the first class interval is starting from 30.5 and not zero, we show it on the graph by marking a kink or a break on the axis.
(ii) We represent the number of students (frequency) on the vertical axis on a suitable scale. Since the maximum frequency is 15, we need to choose the scale to accommodate this maximum frequency.
(iii) We now draw rectangles (or rectangular bars) of width equal to the class-size and lengths according to the frequencies of the corresponding class intervals. For example, the rectangle for the class interval 30.5 - 35.5 will be of width 1 cm and length 4.5 cm.
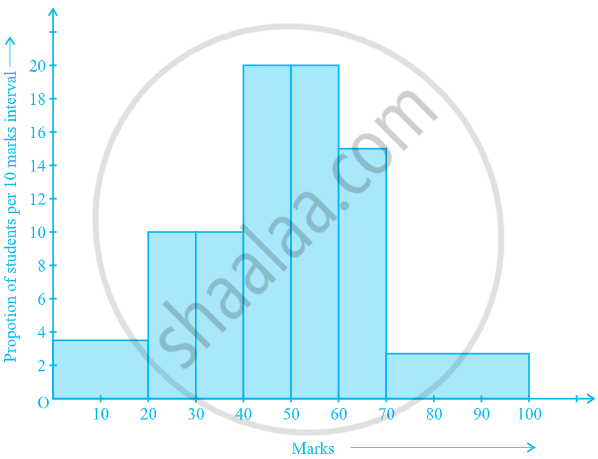
| Marks | Number of students |
| 0 - 20 | 7 |
| 20 - 30 | 10 |
| 30 - 40 | 10 |
| 40 - 50 | 20 |
| 50 - 60 | 20 |
| 60 - 70 | 15 |
| 70 - above | 8 |
| Total | 90 |
- Select a class interval with the minimum class size which is 10.
- The lengths of the rectangles are then modified to be proportionate to the class-size 10. For instance, when the class-size is 20, the length of the rectangle is 7.
So when the class-size is 10, the length of the rectangle will be `7/20 xx 10 = 3.5`.
| Marks | Frequency | Width of the class | Length of the rectangle |
| 0 - 20 | 7 | 20 | `7/20 xx 10` = 3.5 |
| 20 - 30 | 10 | 10 | `10/10 xx 10` = 10 |
| 30 - 40 | 10 | 10 | `10/10 xx 10` = 10 |
| 40 - 50 | 20 | 10 | `20/10 xx 10` = 20 |
| 50 - 60 | 20 | 10 | `20/10 xx 10` = 20 |
| 60 - 70 | 15 | 10 | `15/10 xx 10` = 15 |
| 70 - 100 | 8 | 30 | `8/30 xx 10` = 2.67 |
Shaalaa.com | Concept of Histrogram
Series: Graphical Representation of Data as Histograms
Related QuestionsVIEW ALL [109]
The marks scored by students in Mathematics in a certain examination are given below :
| Marks Scored | Number of Students |
| 0 - 20 | 6 |
| 20 - 40 | 9 |
| 40 - 60 | 14 |
| 60 - 80 | 16 |
| 80 - 100 | 5 |
Draw histogram for the above data.

Construct histograms for following frequency distribution:
| Class Interval | 130-140 | 140-150 | 150-160 | 160-170 | 170-180 |
| Frequency | 24 | 16 | 29 | 20 | 11 |
The time taken, in seconds, to solve a problem for each of 25 persons is as follows:
| 16 | 20 | 26 | 27 | 28 |
| 30 | 33 | 37 | 38 | 40 |
| 42 | 43 | 46 | 46 | 47 |
| 48 | 49 | 50 | 53 | 58 |
| 59 | 60 | 64 | 52 | 20 |
(i) Construct a frequency distribution for these data using a class interval of 10 seconds.
(ii) In a school the weekly pocket money of 50 students is as follow's:
| Weekly pocket money (₹) | No. of student |
| 40 - 50 | 2 |
| 59 - 60 | 8 |
| 60 - 70 | 12 |
| 70 - 80 | 14 |
| 80 - 90 | 8 |
| 90 - 100 | 6 |
Draw a histogram and a frequency polygon on the same graph. Find mode from the graph.
Draw a histogram and frequency polygon to represent the following data (on the same scale) which shows the monthly cost of living index of a city in a period of 2 years:
| Cost of living Index | Number of months |
| 440 - 460 | 2 |
| 460 - 480 | 4 |
| 480 - 500 | 3 |
| 500 - 520 | 5 |
| 520 - 540 | 3 |
| 540 - 560 | 2 |
| 560 - 580 | 1 |
| 580 - 600 | 4 |
| Total | 24 |
