Advertisements
Advertisements
Question
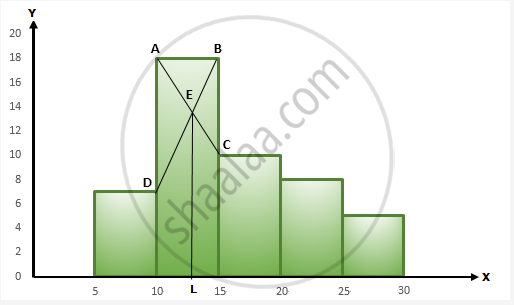
Draw a histogram and hence estimate the mode for the following frequency distribution:
| Class | 0-5 | 5-10 | 10-15 | 15-20 | 20-25 | 25-30 |
| Freq | 0 | 7 | 18 | 10 | 8 | 5 |
Sum
Solution
Histogram is as follows:

In the highest rectangle which represents modal class draw two lines AC and BD intersecting at E.
From E, draw a perpendicular to x-axis meeting at L.
Value of L is the mode. Hence, mode = 13
shaalaa.com
Finding the Mode from the Histogram
Is there an error in this question or solution?
