Advertisements
Advertisements
Question
Draw scatter diagram for the data given below. Is there any correlation between Aptitude score and Grade points?
| Aptitude score | 40 | 50 | 55 | 60 | 70 | 80 |
| Grade points | 1.8 | 3.5 | 2.8 | 1.7 | 2.8 | 3.2 |
Diagram
Solution
| Aptitude score(x) | 40 | 50 | 55 | 60 | 70 | 80 |
| Grade points (y) | 1.8 | 3.5 | 2.8 | 1.7 | 2.8 | 3.2 |
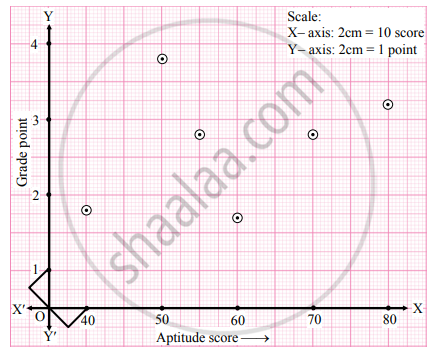
The points are completely scattered i.e., no trend is observed.
∴ There is no correlation between the Aptitude score (X) and Grade point (Y).
shaalaa.com
Is there an error in this question or solution?
APPEARS IN
RELATED QUESTIONS
Draw scatter diagram for the data given below and interpret it.
| x | 10 | 20 | 30 | 40 | 50 | 60 | 70 |
| y | 32 | 20 | 24 | 36 | 40 | 28 | 38 |
For the following data of marks of 7 students in physics (x) and Mathematics (y), draw scatter diagram and state the type of correlation.
| x | 8 | 6 | 2 | 4 | 7 | 8 | 9 |
| y | 6 | 5 | 1 | 4 | 4 | 7 | 8 |
