Advertisements
Advertisements
Question
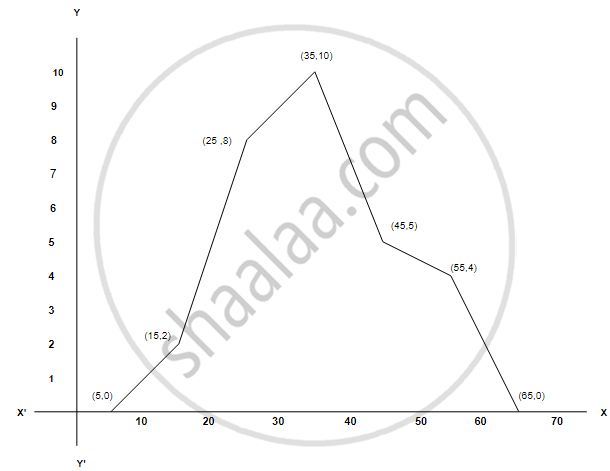
Draw the frequency polygon for the following frequency distribution :
| Class | Frequency |
| 10 - 20 | 02 |
| 20 - 30 | 08 |
| 30 - 40 | 10 |
| 40 - 50 | 05 |
| 50 - 60 | 04 |
Graph
Sum
Solution
| Class | Class mark | Frequency | Points |
| 0-10 | 5 | 0 | (5,0) |
| 10-20 | 15 | 2 | (15,2) |
| 20-30 | 25 | 8 | (25,8) |
| 30-40 | 35 | 10 | (35,10) |
| 40-50 | 45 | 5 | (45,5) |
| 50-60 | 55 | 4 | (55,4) |
| 60-70 | 65 | 0 | (65,0) |
shaalaa.com
Is there an error in this question or solution?
