Advertisements
Advertisements
Question
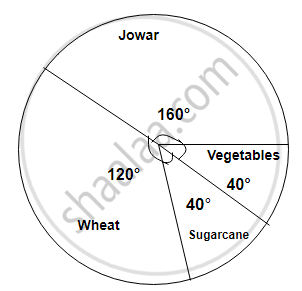
Area under different crops in a certain village is given below. Represent it by pie diagram:
| Crop | Area (in hectare) |
| Jowar | 8000 |
| Wheat | 6000 |
| Sugarcane | 2000 |
| Vegetable | 2000 |
Solution
| Crop | Area (in hectare) | Measure of central angle θ |
| Jowar | 8000 | `8000/18000 xx 360^circ = 160^circ` |
| Wheat | 6000 | `6000/18000xx360^circ = 120^circ` |
| Sugarcane | 2000 | `2000/18000xx360^circ = 40^circ` |
| Vegetable | 2000 | `2000/18000xx360^circ = 40^circ` |
| Total | 18000 | 360° |
APPEARS IN
RELATED QUESTIONS
In one day the sales (in rupees) of different items of a baker's shop are given below:
| Items | Ordinary bread | Fruit bread | Cakes and Pastries | Biscuits | Others | Total |
| Sales (in Rs) | 260 | 40 | 100 | 60 | 20 | 480 |
Draw a pie-chart representing the above sales.
The following data shows the expenditure of a person on different items during a month. Represent the data by a pie-chart.
| Items of expenditure | Rent | Education | Food | Clothing | Others |
| Amount (in Rs) | 2700 | 1800 | 2400 | 1500 | 2400 |
Draw a pie-diagram of the areas of continents of the world given in the following table:
| Continents | Asia | U.S.S.R | Africa | Europe | Noth America | South America | Australia |
| Area (in million sq. km) |
26.9 | 20.5 | 30.3 | 4.9 | 24.3 | 17.9 | 8.5 |
Following data gives the break up of the cost of production of a book:
| Printing | Paper | Binding charges | Advertisement | Royalty | Miscellaneous |
| 30% | 15% | 15% | 20% | 10% | 15% |
Draw a pie- diagram depicting the above information.
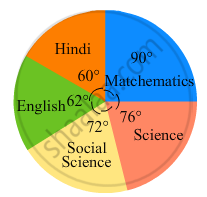
In the following figure, the pie-chart shows the marks obtained by a student in various subjects. If the student scored 135 marks in mathematics, find the total marks in all the subjects. Also, find his score in individual subjects.
The following table shows the daily supply of electricity to different places in a town. To show the information by a pie diagram, measures of central angles of sectors are to be decided.
Complete the following activity to find the measure :
| Places |
Supply of electricity |
Measure of central angle |
| Roads | 4 | `4/30 xx 360 = 48^circ` |
| Factories | 12 | `square/square xx 360 = 144^circ` |
| shops | 6 | `6/30 xx 360 = square` |
| Houses | 8 | `square/square xx 360 = square` |
| Total ⇒ | 30 | `square` |
Medical check up of 180 women was conducted in a health centre in a village. 50 of them were short of haemoglobin, 10 suffered from cataract and 25 had respiratory disorders. The remaining women were healthy. Show the information by a pie diagram.
Electricity used by farmers during different parts of a day for irrigation is as follows:
| Party of the day | Morning | Afternoon | Evening | Night |
| percentage of Electricity Used | 30 | 40 | 20 | 10 |
Draw a pie diagram to represent this information.
The marks obtained by a student in an examination are given below:
| Subject | Marks |
| Marathi | 85 |
| Hindi | 80 |
| English | 95 |
| Mathematics | 100 |
| Total | 360 |
Represent the data using pie diagram.
Draw a pie-chart for the favourite sweets of your family members
Look and find out
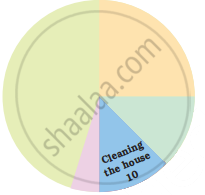
Children who help in making or serving food are
A geometric representation showing the relationship between a whole and its parts is a ______.
Students of a class voted for their favourite colour and a pie chart was prepared based on the data collected.
Observe the pie chart given below and answer questions based on it.
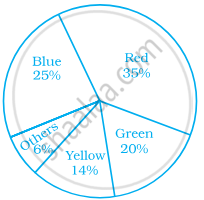
Which of the following is a reasonable conclusion for the given data?
Data collected in a survey shows that 40% of the buyers are interested in buying a particular brand of toothpaste. The central angle of the sector of the pie chart representing this information is ______.
What is the central angle of the sector representing skin and bones together?

Shoes of the following brands are sold in Nov. 2007 at a shoe store. Construct a pie chart for the data.
| Brand | Number of pair of shoes sold |
| A | 130 |
| B | 120 |
| C | 90 |
| D | 40 |
| E | 20 |
In a district, the number of branches of different banks is given below:
| Bank | State Bank of India |
Bank of Baroda |
Punjab National Bank |
Canara Bank |
| Number of Branches | 30 | 17 | 15 | 10 |
Draw a pie chart for this data.
For the development of basic infrastructure in a district, a project of Rs 108 crore approved by Development Bank is as follows:
| Item Head | Road | Electricity | Drinking water | Sewerage |
| Amount In crore (Rs.) |
43.2 | 16.2 | 27.00 | 21.6 |
Draw a pie chart for this data.
A financial counselor gave a client this pie chart describing how to budget his income. If the client brings home Rs. 50,000 each month, how much should he spend in each category?
- Housing
- Food (including eating out)
- Car loan and Maintenance
- Utilities
- Phone
- Clothing
- Entertainment
