Advertisements
Advertisements
Question
A geometric representation showing the relationship between a whole and its parts is a ______.
Options
Pie chart
Histogram
Bar graph
Pictograph
Solution
A geometric representation showing the relationship between a whole and its parts is a pie chart.
Explanation:
A pie chart is a circular statistical graphic which is divided into slices to illustrate numerical proportion. The circle is taken as a whole and the slices are its part.
APPEARS IN
RELATED QUESTIONS
Subjectwise marks obtained by a student in an examination are given below
| Subject | Marks |
| Marathi | 85 |
| Hindi | 85 |
| Science | 90 |
| Mathematics | 100 |
| Total | 360 |
Draw pie diagram
The following pie diagram represents the sectorwise loan amount in crores of rupees distributed by a bank. From the information answer the following questions :
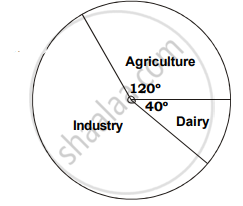
a. If the dairy sector receives `20 crores, then find the total loan disbursed.
b. Find the loan amount for agriculture sector and also for industrial sector.
c. How much additional amount did industrial sector receive than agriculture sector?
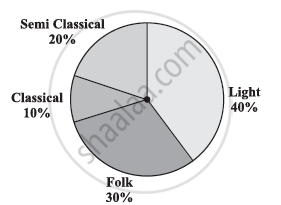
A survey was made to find the type of music that a certain group of young people liked in a city. Adjoining pie chart shows the findings of this survey.
From this pie chart answer the following:
- If 20 people liked classical music, how many young people were surveyed?
- Which type of music is liked by the maximum number of people?
- If a cassette company were to make 1000 CD’s, how many of each type would they make?
The marks obtained by a student in different subjects are shown. Draw a pie diagram showing the information.
| Subject | English | Marathi | Science | Mathematics | Social science | Hindi |
| Marks | 50 | 70 | 80 | 90 | 60 | 50 |
The following table shows the percentages of demands for different fruits registered with a fruit vendor. Show the information by a pie diagram.
| Fruits | Mango | Sweet lime | Apples | Cheeku | Oranges |
| Percentages of demand | 30 | 15 | 25 | 20 | 10 |
The number of hours, spent by a school boy on different activities in a working day, is given below:
| Activities | Sleep | School | Home | Play | Others | Total |
| Number of hours | 8 | 7 | 4 | 2 | 3 | 24 |
Present the information in the form of a pie-chart.
The percentages of various categories of workers in a state are given in the following table.
| Categoies | Culti-vators | Agricultural Labourers | Industrial Workers | Commercial Workers | Others |
| % of workers | 40 | 25 | 12.5 | 10 | 12.5 |
Present the information in the form a pie-chart.
The following table shows the expenditure incurred by a publisher in publishing a book:
| Items | Paper | Printing | Binding | Advertising | Miscellaneous |
| Expenditure (in%) | 35% | 20% | 10% | 5% | 30% |
Present the above data in the form of a pie-chart.
Percentage of the different products of a village in a particular district are given below. Draw a pie-chart representing this information.
| Items | Wheat | Pulses | Jwar | Grounnuts | Vegetables | Total |
| % | `125/3` | `125/6` | `25/2` | `50/3` | `25/3` | 100 |
Draw a pie-diagram for the following data of expenditure pattern in a family:
| Items | Food | Clothing | Rent | Education | Unforeseen events | Midicine |
| Expenditure (in percent) | 40% | 20% | 10% | 10% | 15% | 5% |
The pie chart (as shown in the figure 25.23) represents the amount spent on different sports by a sports club in a year. If the total money spent by the club on sports is Rs 1,08,000, find the amount spent on each sport.

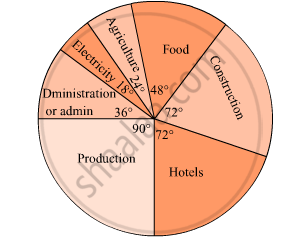
The pie diagram in figure shows the proportions of different workers in a town. Answer the following question with its help.
What is the percentage of workers in production ?
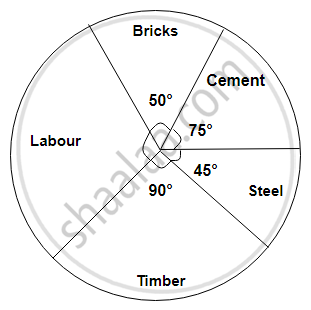
The following diagram represents expenditure on different items in constructing a building.
If the total construction cost of a building is Rs.540000, answer the following questions :
Find the central angle for labour expenditure.
Subjective marks obtained by a student in an examination are given below:
| Subject | Marks |
| Marathi | 85 |
| English | 90 |
| Science | 85 |
| Mathematics | 100 |
| Total | 360 |
Draw a pie diagram to represent the above data.
| Age group (in years) |
No. of Persons | Measure of central angle |
| 20 – 25 | 80 | `square/200 xx 360^circ = square` |
| 25 – 30 | 60 | `60/200 xx 360^circ = square` |
| 30 – 35 | 35 | `35/200 xx square = 63^circ` |
| 35 – 40 | 25 | `25/200 xx 360^circ = square` |
| Total | 200 | `square` |
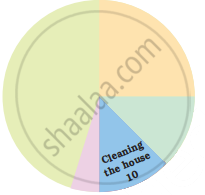
Look and find out
Children who help in making or serving food are
The following pie chart represents the distribution of proteins in parts of a human body. What is the ratio of distribution of proteins in the muscles to that of proteins in the bones?

What is the central angle of the sector representing hormones enzymes and other proteins?
The central angle of a sector in a pie chart cannot be more than 180°.
Following is a pie chart showing the amount spent in rupees (in thousands) by a company on various modes of advertising for a product.
Now answer the following questions.
- Which type of media advertising is the greatest amount of the total?
- Which type of media advertising is the least amount of the total?
- What percent of the total advertising amount is spent on direct mail campaigns?
- What percent of the advertising amount is spent on newspaper and magazine advertisements?
- What media types do you think are included in miscellaneous? Why aren’t those media types given their own category?
- Television
- Newspapers
- Magazines
- Radio
- Business papers
- Direct mail
- Yellow pages
- Outdoor
- Miscellaneous
