Advertisements
Advertisements
Question
| Age group (in years) |
No. of Persons | Measure of central angle |
| 20 – 25 | 80 | `square/200 xx 360^circ = square` |
| 25 – 30 | 60 | `60/200 xx 360^circ = square` |
| 30 – 35 | 35 | `35/200 xx square = 63^circ` |
| 35 – 40 | 25 | `25/200 xx 360^circ = square` |
| Total | 200 | `square` |
Solution
| Age group (in years) |
No. of Persons | Measure of central angle |
| 20 – 25 | 80 | `bb80/200 xx 360^circ = bb(144^circ)` |
| 25 – 30 | 60 | `60/200 xx 360^circ = bb(108^circ)` |
| 30 – 35 | 35 | `35/200 xx bb(360^circ) = 63^circ` |
| 35 – 40 | 25 | `25/200 xx 360^circ = bb(45^circ)` |
| Total | 200 | `bb(360^circ)` |
APPEARS IN
RELATED QUESTIONS
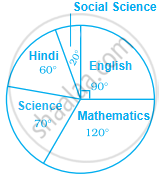
The marks obtained by a student in different subjects are shown. Draw a pie diagram showing the information.
| Subject | English | Marathi | Science | Mathematics | Social science | Hindi |
| Marks | 50 | 70 | 80 | 90 | 60 | 50 |
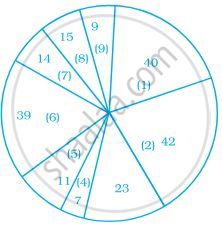
In a tree plantation programme, the number of trees planted by students of different classes is given in the following table. Draw a pie diagram showing the information.
| Standard | 5th | 6th | 7th | 8th | 9th | 10th |
| No. of trees | 40 | 50 | 75 | 50 | 70 | 75 |
The annual investments of a family are shown in the adjacent pie diagram. Answer the following questions based on it.
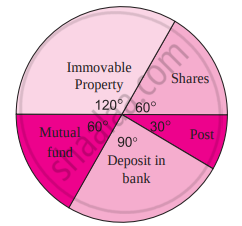
(1) If the investment in shares is ₹ 2000, find the total investment.
(2) How much amount is deposited in the bank?
(3) How much more money is invested in immovable property than in mutual fund?
(4) How much amount is invested in post?
The number of hours, spent by a school boy on different activities in a working day, is given below:
| Activities | Sleep | School | Home | Play | Others | Total |
| Number of hours | 8 | 7 | 4 | 2 | 3 | 24 |
Present the information in the form of a pie-chart.
The pie-chart given in the following shows the annual agricultural production of an Indian state. If the total production of all the commodities is 81000 tonnes, find the production (in tonnes) of
(i) Wheat
(ii) Sugar
(iii) Rice
(iv) Maize
(v) Gram

The pie chart (as shown in the figure 25.23) represents the amount spent on different sports by a sports club in a year. If the total money spent by the club on sports is Rs 1,08,000, find the amount spent on each sport.

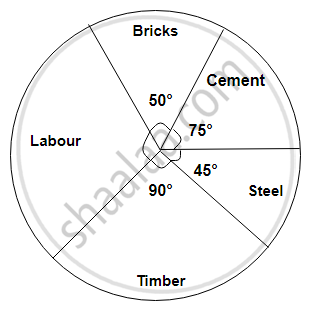
The following diagram represents expenditure on different items in constructing a building.
If the total construction cost of a building is Rs.540000, answer the following questions :
Find the expenditure on labour.
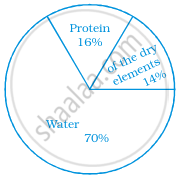
Write down the percentage of content in human body from the given pie-chart.
Draw a pie-chart for the favourite sweets of your family members
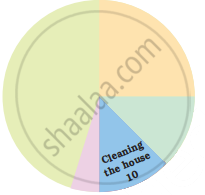
In the EVS period, the teacher asked children whether they help their parents at home. There were different answers. Children named the work in which they help their parents the most. The teacher collected their answers and made a table.
| Help most in housework | Number of children |
| Going to the market | 47 |
| Washing utensils | 15 |
| Washing clothes | 3 |
| Marking serving food | 25 |
| Cleaning the house | 10 |
| Total children who said they help their parents |
Now you can fill the chapati chart to show the numbers given in the table.
Look and find out
Children who help in making or serving food are
In a pie chart, the total angle at the centre of the circle is ______.
Monthly salary of a person is Rs. 15000. The central angle of the sector representing his expenses on food and house rent on a pie chart is 60°. The amount he spends on food and house rent is ______.
The following pie chart gives the distribution of constituents in the human body. The central angle of the sector showing the distribution of protein and other constituents is ______.
In a pie chart two or more central angles can be equal.
Study the pie chart given below depicting the marks scored by a student in an examination out of 540. Find the marks obtained by him in each subject.
For the development of basic infrastructure in a district, a project of Rs 108 crore approved by Development Bank is as follows:
| Item Head | Road | Electricity | Drinking water | Sewerage |
| Amount In crore (Rs.) |
43.2 | 16.2 | 27.00 | 21.6 |
Draw a pie chart for this data.
The following data represents the approximate percentage of water in various oceans. Prepare a pie chart for the given data.
| Pacific | 40% |
| Atlantic | 30% |
| Indian | 20% |
| Others | 10% |
Following is a pie chart showing the amount spent in rupees (in thousands) by a company on various modes of advertising for a product.
Now answer the following questions.
- Which type of media advertising is the greatest amount of the total?
- Which type of media advertising is the least amount of the total?
- What percent of the total advertising amount is spent on direct mail campaigns?
- What percent of the advertising amount is spent on newspaper and magazine advertisements?
- What media types do you think are included in miscellaneous? Why aren’t those media types given their own category?
- Television
- Newspapers
- Magazines
- Radio
- Business papers
- Direct mail
- Yellow pages
- Outdoor
- Miscellaneous
