Advertisements
Advertisements
Question
Monthly salary of a person is Rs. 15000. The central angle of the sector representing his expenses on food and house rent on a pie chart is 60°. The amount he spends on food and house rent is ______.
Options
Rs. 5000
Rs. 2500
Rs. 6000
Rs. 9000
Solution
Monthly salary of a person is Rs. 15000. The central angle of the sector representing his expenses on food and house rent on a pie chart is 60°. The amount he spends on food and house rent is Rs. 2500.
Explanation:
We know that,
Central angle of the pie chart = 360°
Central angle of the sector of pie chart = 60°
Monthly salary of a person = Rs. 15000
Part of monthly salary spent on food and house rent = `"Central angle of the sector of pie chart"/"Central angle of the pie chart"`
⇒ Part of monthly salary spent on food and house rent = `(60^circ)/(360^circ)`
⇒ part of monthly salary spent on food and house rent = `1/6`
⇒ Amount of monthly salary spent on food and house rent = `1/6 xx 15000`
⇒ Amount spent on food and house rent = Rs. 2500
Hence, the amount he spends on food and house rent is Rs. 2500.
APPEARS IN
RELATED QUESTIONS
Subjectwise marks obtained by a student in an examination are given below
| Subject | Marks |
| Marathi | 85 |
| Hindi | 85 |
| Science | 90 |
| Mathematics | 100 |
| Total | 360 |
Draw pie diagram
A group of 360 people were asked to vote for their favourite season from the three seasons rainy, winter and summer.
- Which season got the most votes?
- Find the central angle of each sector.
- Draw a pie chart to show this information.
| Season | No. of votes |
| Summer | 90 |
| Rainy | 120 |
| Winter | 150 |
The adjoining pie chart gives the marks scored in an examination by a student in Hindi, English, Mathematics, Social Science and Science. If the total marks obtained by the students were 540, answer the following questions.
- In which subject did the student score 105 marks?
(Hint: For 540 marks, the central angle = 360°. So, for 105 marks, what is the central angle?) - How many more marks were obtained by the student in Mathematics than in Hindi?
- Examine whether the sum of the marks obtained in Social Science and Mathematics is more than that in Science and Hindi.
(Hint: Just study the central angles)

The number of students in a hostel speaking different languages is given below. Display the data in a pie chart.
| Language | Hindi | English | Marathi | Tamil | Bengali | Total |
| Number of students | 40 | 12 | 9 | 7 | 4 | 72 |
The marks obtained by a student in different subjects are shown. Draw a pie diagram showing the information.
| Subject | English | Marathi | Science | Mathematics | Social science | Hindi |
| Marks | 50 | 70 | 80 | 90 | 60 | 50 |
The number of hours, spent by a school boy on different activities in a working day, is given below:
| Activities | Sleep | School | Home | Play | Others | Total |
| Number of hours | 8 | 7 | 4 | 2 | 3 | 24 |
Present the information in the form of a pie-chart.
The following table shows the expenditure incurred by a publisher in publishing a book:
| Items | Paper | Printing | Binding | Advertising | Miscellaneous |
| Expenditure (in%) | 35% | 20% | 10% | 5% | 30% |
Present the above data in the form of a pie-chart.
Draw a pie-diagram for the following data of expenditure pattern in a family:
| Items | Food | Clothing | Rent | Education | Unforeseen events | Midicine |
| Expenditure (in percent) | 40% | 20% | 10% | 10% | 15% | 5% |
Draw a pie-diagram of the areas of continents of the world given in the following table:
| Continents | Asia | U.S.S.R | Africa | Europe | Noth America | South America | Australia |
| Area (in million sq. km) |
26.9 | 20.5 | 30.3 | 4.9 | 24.3 | 17.9 | 8.5 |
Draw a pie-diagram representing the relative frequencies (expressed as percentage) of the eight classes as given below:
12.6, 18.2, 17.5, 20.3, 2.8, 4.2, 9.8, 14.7
The pie chart (as shown in the figure 25.23) represents the amount spent on different sports by a sports club in a year. If the total money spent by the club on sports is Rs 1,08,000, find the amount spent on each sport.

On an environment day, students in a school planted 120 trees under plantation project. The information regarding the project is shown in the following table. Show it by a pie diagram.
|
Tree name
|
Karanj | Behada | Arjun | Bakul | Kadunimb |
| No. of trees | 20 | 28 | 24 | 22 | 26 |
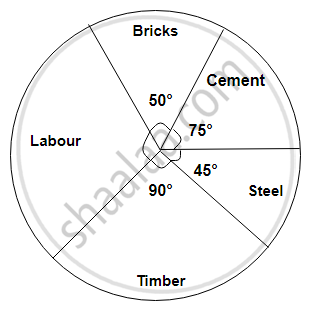
The following diagram represents expenditure on different items in constructing a building.
If the total construction cost of a building is Rs.540000, answer the following questions :
Find the expenditure on labour.
Electricity used by farmers during different parts of a day for irrigation is as follows:
| Party of the day | Morning | Afternoon | Evening | Night |
| percentage of Electricity Used | 30 | 40 | 20 | 10 |
Draw a pie diagram to represent this information.
The number of hours, spent by a school boy in different activities in a day is given below :
| Activity | Sleep | School | Play | Homework | Others | Total |
| Number of Hours | 7 | 7 | 2 | 4 | 4 | 24 |
Represent the above information using a pie diagram.
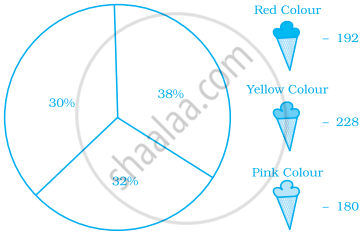
Students of a class voted for their favourite colour and a pie chart was prepared based on the data collected.
Observe the pie chart given below and answer questions based on it.
Which colour received `1/5` of the votes?
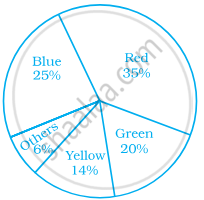
Students of a class voted for their favourite colour and a pie chart was prepared based on the data collected.
Observe the pie chart given below and answer questions based on it.
Which of the following is a reasonable conclusion for the given data?
What is the central angle of the sector representing skin and bones together?

In the time table of a school, periods allotted per week to different teaching subjects are given below:
| Subject | Hindi | English | Maths | Science | Social Science |
Computer | Sanskrit |
| Periods Allotted |
7 | 8 | 8 | 8 | 7 | 4 | 3 |
Draw a pie chart for this data.
Identify which symbol should appear in each sector.