Advertisements
Advertisements
प्रश्न
Monthly salary of a person is Rs. 15000. The central angle of the sector representing his expenses on food and house rent on a pie chart is 60°. The amount he spends on food and house rent is ______.
विकल्प
Rs. 5000
Rs. 2500
Rs. 6000
Rs. 9000
उत्तर
Monthly salary of a person is Rs. 15000. The central angle of the sector representing his expenses on food and house rent on a pie chart is 60°. The amount he spends on food and house rent is Rs. 2500.
Explanation:
We know that,
Central angle of the pie chart = 360°
Central angle of the sector of pie chart = 60°
Monthly salary of a person = Rs. 15000
Part of monthly salary spent on food and house rent = `"Central angle of the sector of pie chart"/"Central angle of the pie chart"`
⇒ Part of monthly salary spent on food and house rent = `(60^circ)/(360^circ)`
⇒ part of monthly salary spent on food and house rent = `1/6`
⇒ Amount of monthly salary spent on food and house rent = `1/6 xx 15000`
⇒ Amount spent on food and house rent = Rs. 2500
Hence, the amount he spends on food and house rent is Rs. 2500.
APPEARS IN
संबंधित प्रश्न
Find the correct answer from the alternatives given.
The persons of O - blood group are 40%. The classification of persons based on blood groups is to be shown by a pie diagram. What should be the measures of angle for the persons of O - blood group?
The number of hours, spent by a school boy on different activities in a working day, is given below:
| Activities | Sleep | School | Home | Play | Others | Total |
| Number of hours | 8 | 7 | 4 | 2 | 3 | 24 |
Present the information in the form of a pie-chart.
The following data shows the expenditure of a person on different items during a month. Represent the data by a pie-chart.
| Items of expenditure | Rent | Education | Food | Clothing | Others |
| Amount (in Rs) | 2700 | 1800 | 2400 | 1500 | 2400 |
Percentage of the different products of a village in a particular district are given below. Draw a pie-chart representing this information.
| Items | Wheat | Pulses | Jwar | Grounnuts | Vegetables | Total |
| % | `125/3` | `125/6` | `25/2` | `50/3` | `25/3` | 100 |
Draw a pie-diagram of the areas of continents of the world given in the following table:
| Continents | Asia | U.S.S.R | Africa | Europe | Noth America | South America | Australia |
| Area (in million sq. km) |
26.9 | 20.5 | 30.3 | 4.9 | 24.3 | 17.9 | 8.5 |
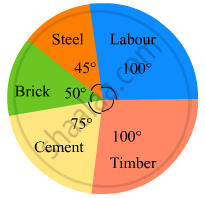
The following data gives the amount spent on the construction of a house. Draw a pie diagram.
| Items | Cement | Timber | Bricks | Labour | Steel | Miscellaneous |
| Expenditure (in thousand Rs) |
60 | 30 | 45 | 75 | 45 | 45 |
Represent the following data by a pie-diagram:
| Items of expenditure | Expenditure | |
| Family A | Family B | |
| Food | 4000 | 6400 |
| Clothing | 2500 | 480 |
| Rent | 1500 | 3200 |
| Education | 400 | 1000 |
| Miscellaneous | 1600 | 600 |
| Total | 10000 | 16000 |
Draw a pie-diagram for the following data of the investment pattern in a five year plan:
| Agriculture | Irrigation and Power | Small Industries | Transport | Social service | Miscellaneous |
| 14% | 16% | 29% | 17% | 16% | 8% |
The pie-chart given in the following represents the expenditure on different items in constructing a flat in Delhi. If the expenditure incurred on cement is Rs 112500, find the following:
(i) Total cost of the flat.
(ii) Expenditure incurred on labour.
The pie-chart given in the following shows the annual agricultural production of an Indian state. If the total production of all the commodities is 81000 tonnes, find the production (in tonnes) of
(i) Wheat
(ii) Sugar
(iii) Rice
(iv) Maize
(v) Gram

A survey of students was made to know which game they like. The data obtained in the survey is presented in the adjacent pie diagram. If the total number of students are 1000,
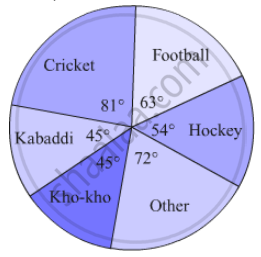
(1) How many students like cricket ?
(2) How many students like football ?
(3) How many students prefer other games ?
Electricity used by farmers during different parts of a day for irrigation is as follows:
| Party of the day | Morning | Afternoon | Evening | Night |
| percentage of Electricity Used | 30 | 40 | 20 | 10 |
Draw a pie diagram to represent this information.
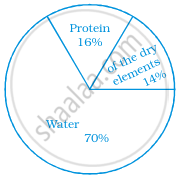
Write down the percentage of content in human body from the given pie-chart.
The number of varieties of ice creams in an ice cream parlour is given below as a pie-chart.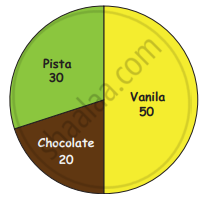
(i) How many varieties of Ice creams are there?
(ii) Find the number of Vanilla Ice creams ______.
(iii) Find the total number of Chocolate and Pista Ice cream _______.
(iv) Find the total number of Ice creams _______.
| Age group (in years) |
No. of Persons | Measure of central angle |
| 20 – 25 | 80 | `square/200 xx 360^circ = square` |
| 25 – 30 | 60 | `60/200 xx 360^circ = square` |
| 30 – 35 | 35 | `35/200 xx square = 63^circ` |
| 35 – 40 | 25 | `25/200 xx 360^circ = square` |
| Total | 200 | `square` |
Students of a class voted for their favourite colour and a pie chart was prepared based on the data collected.
Observe the pie chart given below and answer questions based on it.
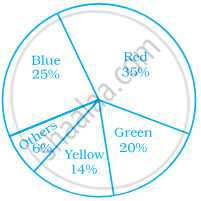
If 400 students voted in all, then how many did vote ‘Others’ colour as their favourite?
The following pie chart gives the distribution of constituents in the human body. The central angle of the sector showing the distribution of protein and other constituents is ______.
What is the central angle of the sector representing hormones enzymes and other proteins?

In a pie chart two or more central angles can be equal.
Shoes of the following brands are sold in Nov. 2007 at a shoe store. Construct a pie chart for the data.
| Brand | Number of pair of shoes sold |
| A | 130 |
| B | 120 |
| C | 90 |
| D | 40 |
| E | 20 |
