Advertisements
Advertisements
प्रश्न
The number of varieties of ice creams in an ice cream parlour is given below as a pie-chart.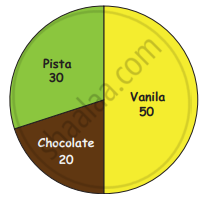
(i) How many varieties of Ice creams are there?
(ii) Find the number of Vanilla Ice creams ______.
(iii) Find the total number of Chocolate and Pista Ice cream _______.
(iv) Find the total number of Ice creams _______.
उत्तर
(i) Three
(ii) Find the number of Vanilla Ice creams 50.
(iii) Find the total number of Chocolate and Pista Ice cream 50 ...(30 to 20).
(iv) Find the total number of Ice creams 100.
APPEARS IN
संबंधित प्रश्न
Find the correct answer from the alternatives given.
Different expenditures incurred on the construction of a building were shown by a pie diagram. The expenditure Rs 45,000 on cement was shown by a sector of central angle of 75°. What was the total expenditure of the construction ?
The number of hours, spent by a school boy on different activities in a working day, is given below:
| Activities | Sleep | School | Home | Play | Others | Total |
| Number of hours | 8 | 7 | 4 | 2 | 3 | 24 |
Present the information in the form of a pie-chart.
Represent the following data with the help of a pie-diagram:
| Items | Wheat | Rice | Tea |
| Production (in metric tons) | 3260 | 1840 | 900 |
The following pie-chart shows the number of students admitted in different faculties of a college. If 1000 students are admitted in Science answer the following:
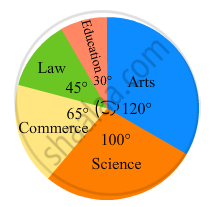
(i) What is the total number of students?
(ii) What is the ratio of students in science and arts?
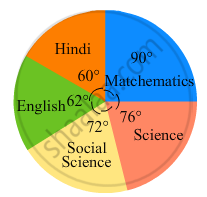
In the following figure, the pie-chart shows the marks obtained by a student in various subjects. If the student scored 135 marks in mathematics, find the total marks in all the subjects. Also, find his score in individual subjects.
Electricity used by farmers during different parts of a day for irrigation is as follows:
| Party of the day | Morning | Afternoon | Evening | Night |
| percentage of Electricity Used | 30 | 40 | 20 | 10 |
Draw a pie diagram to represent this information.
The number of hours, spent by a school boy in different activities in a day is given below :
| Activity | Sleep | School | Play | Homework | Others | Total |
| Number of Hours | 7 | 7 | 2 | 4 | 4 | 24 |
Represent the above information using a pie diagram.
Data collected in a survey shows that 40% of the buyers are interested in buying a particular brand of toothpaste. The central angle of the sector of the pie chart representing this information is ______.
What is the central angle of the sector representing hormones enzymes and other proteins?

The pie chart on the right shows the result of a survey carried out to find the modes of travel used by the children to go to school. Study the pie chart and answer the questions that follow.
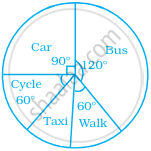
- What is the most common mode of transport?
- What fraction of children travel by car?
- If 18 children travel by car, how many children took part in the survey?
- How many children use taxi to travel to school?
- By which two modes of transport are equal number of children travelling?
