Advertisements
Advertisements
प्रश्न
The number of hours, spent by a school boy in different activities in a day is given below :
| Activity | Sleep | School | Play | Homework | Others | Total |
| Number of Hours | 7 | 7 | 2 | 4 | 4 | 24 |
Represent the above information using a pie diagram.
उत्तर
| Activity | No. of Hours | θ = Measure of Central angle |
| Sleep | 7 | `7/24 xx 360 = 105` |
| School | 7 | `7/24 xx 360 = 105` |
| Play | 2 | `2/24 xx 360 = 30` |
| Homework | 4 | `4/24 xx 360 = 60` |
| Other | 4 | `4/24 xx 360 = 60` |
| Total | 24 | 360 |
Pie Diagram

APPEARS IN
संबंधित प्रश्न
The sales of salesmen in a week are given in the pie diagram. Study the diagram and answer the following questions. If the total sale due to salesmen A is Rs. 18,000, then
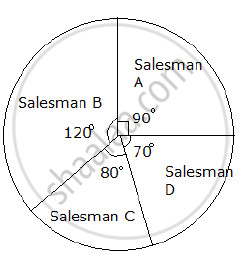
a) Find the total sale.
b) Find the sale of each salesman.
c) Find the salesman with the highest sale.
d) Find the difference between the highest sale and the lowest sale.
The marks obtained by a student in an examination out of 100 are given below. The total marks obtained in various subjects are as follows:
| Subject | Marks |
| Marathi | 85 |
| English | 85 |
| Science | 90 |
| Mathematics | 100 |
| Total | 360 |
Represent the above data using pie diagram
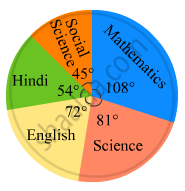
The marks obtained by a student in different subjects are shown. Draw a pie diagram showing the information.
| Subject | English | Marathi | Science | Mathematics | Social science | Hindi |
| Marks | 50 | 70 | 80 | 90 | 60 | 50 |
The following table shows the percentages of demands for different fruits registered with a fruit vendor. Show the information by a pie diagram.
| Fruits | Mango | Sweet lime | Apples | Cheeku | Oranges |
| Percentages of demand | 30 | 15 | 25 | 20 | 10 |
The following table shows the percentages of vehicles passing a signal. Find out the measures of central angle to show the information by a pie diagram and hence draw the pie diagram.
| Type of Vehicle | Bicycle | Two wheeler | Car | Bus | Rickshaw |
| Percentage | 10 | 30 | 20 | 20 | 20 |
The following table shows the expenditure incurred by a publisher in publishing a book:
| Items | Paper | Printing | Binding | Advertising | Miscellaneous |
| Expenditure (in%) | 35% | 20% | 10% | 5% | 30% |
Present the above data in the form of a pie-chart.
Draw a pie-diagram for the following data of expenditure pattern in a family:
| Items | Food | Clothing | Rent | Education | Unforeseen events | Midicine |
| Expenditure (in percent) | 40% | 20% | 10% | 10% | 15% | 5% |
The following data gives the amount spent on the construction of a house. Draw a pie diagram.
| Items | Cement | Timber | Bricks | Labour | Steel | Miscellaneous |
| Expenditure (in thousand Rs) |
60 | 30 | 45 | 75 | 45 | 45 |
Following data gives the break up of the cost of production of a book:
| Printing | Paper | Binding charges | Advertisement | Royalty | Miscellaneous |
| 30% | 15% | 15% | 20% | 10% | 15% |
Draw a pie- diagram depicting the above information.
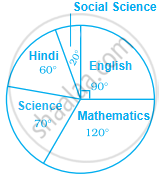
In the following figure, the pie-chart shows the marks obtained by a student in an examination. If the student secures 440 marks in all, calculate his marks in each of the given subjects.
On an environment day, students in a school planted 120 trees under plantation project. The information regarding the project is shown in the following table. Show it by a pie diagram.
|
Tree name
|
Karanj | Behada | Arjun | Bakul | Kadunimb |
| No. of trees | 20 | 28 | 24 | 22 | 26 |
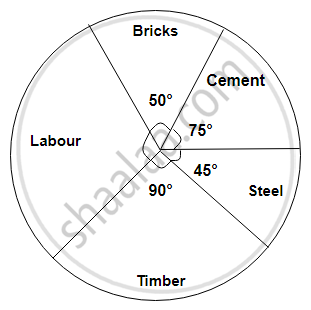
The following diagram represents expenditure on different items in constructing a building.
If the total construction cost of a building is Rs.540000, answer the following questions :
Find the central angle for labour expenditure.
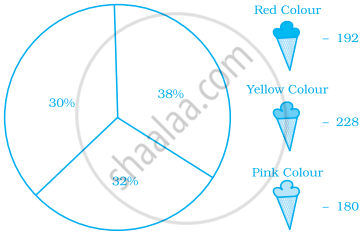
The number of varieties of ice creams in an ice cream parlour is given below as a pie-chart.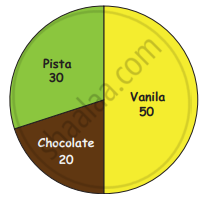
(i) How many varieties of Ice creams are there?
(ii) Find the number of Vanilla Ice creams ______.
(iii) Find the total number of Chocolate and Pista Ice cream _______.
(iv) Find the total number of Ice creams _______.
The following pie chart represents the distribution of proteins in parts of a human body. What is the ratio of distribution of proteins in the muscles to that of proteins in the bones?

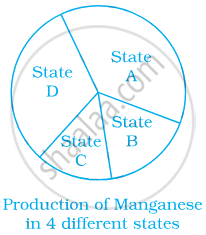
From the given pie chart, we can infer that production of Manganese is least in state B.
Study the pie chart given below depicting the marks scored by a student in an examination out of 540. Find the marks obtained by him in each subject.
A survey was carried out to find the favourite beverage preferred by a certain group of young people. The following pie chart shows the findings of this survey.
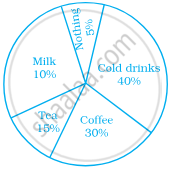
From this pie chart answer the following:
- Which type of beverage is liked by the maximum number of people.
- If 45 people like tea, how many people were surveyed?
Identify which symbol should appear in each sector.
A financial counselor gave a client this pie chart describing how to budget his income. If the client brings home Rs. 50,000 each month, how much should he spend in each category?
- Housing
- Food (including eating out)
- Car loan and Maintenance
- Utilities
- Phone
- Clothing
- Entertainment
