Advertisements
Advertisements
प्रश्न
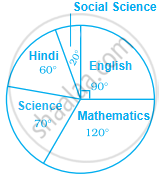
Study the pie chart given below depicting the marks scored by a student in an examination out of 540. Find the marks obtained by him in each subject.
उत्तर
| Subject | Percentage | Marks Obtained |
| Hindi | 16.67% | Marks = Marks = 90 approx |
| English | 25% |
Marks = Marks = 135 |
| Social Science | 5.55% | Marks = Marks = 30 approx |
| Mathematics | 33.33% | Marks = Marks = 180 approx |
| Science | 19.44% | Marks = Marks = 105 approx |
APPEARS IN
संबंधित प्रश्न
Subjectwise marks obtained by a student in an examination are given below
| Subject | Marks |
| Marathi | 85 |
| Hindi | 85 |
| Science | 90 |
| Mathematics | 100 |
| Total | 360 |
Draw pie diagram
The adjoining pie chart gives the marks scored in an examination by a student in Hindi, English, Mathematics, Social Science and Science. If the total marks obtained by the students were 540, answer the following questions.
- In which subject did the student score 105 marks?
(Hint: For 540 marks, the central angle = 360°. So, for 105 marks, what is the central angle?) - How many more marks were obtained by the student in Mathematics than in Hindi?
- Examine whether the sum of the marks obtained in Social Science and Mathematics is more than that in Science and Hindi.
(Hint: Just study the central angles)

The number of students in a hostel speaking different languages is given below. Display the data in a pie chart.
| Language | Hindi | English | Marathi | Tamil | Bengali | Total |
| Number of students | 40 | 12 | 9 | 7 | 4 | 72 |
In one day the sales (in rupees) of different items of a baker's shop are given below:
| Items | Ordinary bread | Fruit bread | Cakes and Pastries | Biscuits | Others | Total |
| Sales (in Rs) | 260 | 40 | 100 | 60 | 20 | 480 |
Draw a pie-chart representing the above sales.
Draw a pie-diagram representing the relative frequencies (expressed as percentage) of the eight classes as given below:
12.6, 18.2, 17.5, 20.3, 2.8, 4.2, 9.8, 14.7
Following is the break up of the expenditure of a family on different items of consumption:
| Items | Food | Clothing | Rent | Education | Fuel etc. | Medicine | Miscellaneous |
| Expenditure (in Rs) | 1600 | 200 | 600 | 150 | 100 | 80 | 270 |
Draw a pie-diagram to represent the above data.
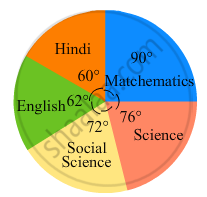
In the following figure, the pie-chart shows the marks obtained by a student in various subjects. If the student scored 135 marks in mathematics, find the total marks in all the subjects. Also, find his score in individual subjects.
The following table shows the daily supply of electricity to different places in a town. To show the information by a pie diagram, measures of central angles of sectors are to be decided.
Complete the following activity to find the measure :
| Places |
Supply of electricity |
Measure of central angle |
| Roads | 4 | |
| Factories | 12 | |
| shops | 6 | |
| Houses | 8 | |
| Total ⇒ | 30 |
Medical check up of 180 women was conducted in a health centre in a village. 50 of them were short of haemoglobin, 10 suffered from cataract and 25 had respiratory disorders. The remaining women were healthy. Show the information by a pie diagram.
Subjective marks obtained by a student in an examination are given below:
| Subject | Marks |
| Marathi | 85 |
| English | 90 |
| Science | 85 |
| Mathematics | 100 |
| Total | 360 |
Draw a pie diagram to represent the above data.
Write down the percentage of content in human body from the given pie-chart.
Collect information about the favorite pets of your classmates. Draw bar-graph and pie-chart for the same data
| Age group (in years) |
No. of Persons | Measure of central angle |
| 20 – 25 | 80 | |
| 25 – 30 | 60 | |
| 30 – 35 | 35 | |
| 35 – 40 | 25 | |
| Total | 200 |
The following pie chart represents the distribution of proteins in parts of a human body. What is the ratio of distribution of proteins in the muscles to that of proteins in the bones?

Sum of all the central angles in a pie chart is 360°.
In a pie chart two or more central angles can be equal.
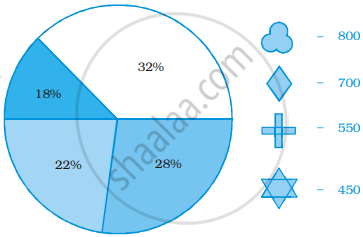
Identify which symbol should appear in each sector.
A financial counselor gave a client this pie chart describing how to budget his income. If the client brings home Rs. 50,000 each month, how much should he spend in each category?
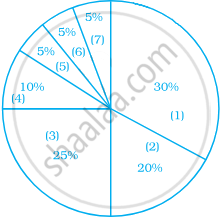
- Housing
- Food (including eating out)
- Car loan and Maintenance
- Utilities
- Phone
- Clothing
- Entertainment
