Advertisements
Advertisements
प्रश्न
Identify which symbol should appear in each sector.
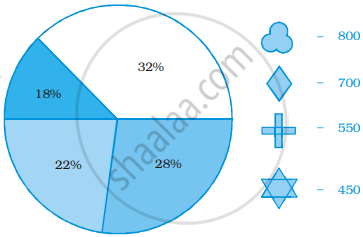
उत्तर
From the given figure,
Total number of symbol = 800 + 700 + 550 + 450 = 2500
Then,
(i) `32/100 xx 2500 = 800`
∴  symbol should appear in sector having 32%.
(ii) `28/100 xx 2500 = 700`
∴  symbol should appear in sector having 28%.
(iii) `22/100 xx 2500 = 550`
∴  symbol should appear in sector having 22%.
(iv) `18/100 xx 2500 = 450`
∴  symbol should appear in sector having 18%.
APPEARS IN
संबंधित प्रश्न
Area under different crops in a certain village is given below. Represent it by a pie diagram :
| Corps | Area (in Hectares) |
| Jowar | 80 |
| Wheat | 20 |
| Sugarcane | 60 |
| Vegetables | 20 |
The sales of salesmen in a week are given in the pie diagram. Study the diagram and answer the following questions. If the total sale due to salesmen A is Rs. 18,000, then
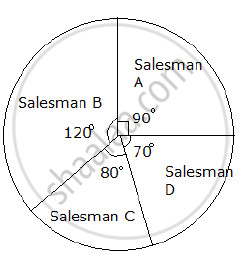
a) Find the total sale.
b) Find the sale of each salesman.
c) Find the salesman with the highest sale.
d) Find the difference between the highest sale and the lowest sale.
The following pie diagram represents the sectorwise loan amount in crores of rupees distributed by a bank. From the information answer the following questions :
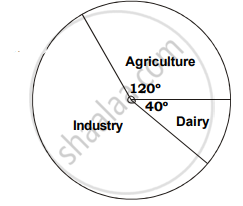
a. If the dairy sector receives `20 crores, then find the total loan disbursed.
b. Find the loan amount for agriculture sector and also for industrial sector.
c. How much additional amount did industrial sector receive than agriculture sector?
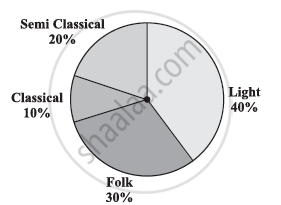
A survey was made to find the type of music that a certain group of young people liked in a city. Adjoining pie chart shows the findings of this survey.
From this pie chart answer the following:
- If 20 people liked classical music, how many young people were surveyed?
- Which type of music is liked by the maximum number of people?
- If a cassette company were to make 1000 CD’s, how many of each type would they make?
A group of 360 people were asked to vote for their favourite season from the three seasons rainy, winter and summer.
- Which season got the most votes?
- Find the central angle of each sector.
- Draw a pie chart to show this information.
| Season | No. of votes |
| Summer | 90 |
| Rainy | 120 |
| Winter | 150 |
The adjoining pie chart gives the marks scored in an examination by a student in Hindi, English, Mathematics, Social Science and Science. If the total marks obtained by the students were 540, answer the following questions.
- In which subject did the student score 105 marks?
(Hint: For 540 marks, the central angle = 360°. So, for 105 marks, what is the central angle?) - How many more marks were obtained by the student in Mathematics than in Hindi?
- Examine whether the sum of the marks obtained in Social Science and Mathematics is more than that in Science and Hindi.
(Hint: Just study the central angles)

The marks obtained by a student in different subjects are shown. Draw a pie diagram showing the information.
| Subject | English | Marathi | Science | Mathematics | Social science | Hindi |
| Marks | 50 | 70 | 80 | 90 | 60 | 50 |
Draw a pie-diagram for the following data of expenditure pattern in a family:
| Items | Food | Clothing | Rent | Education | Unforeseen events | Midicine |
| Expenditure (in percent) | 40% | 20% | 10% | 10% | 15% | 5% |
The pie-chart given in the following represents the expenditure on different items in constructing a flat in Delhi. If the expenditure incurred on cement is Rs 112500, find the following:
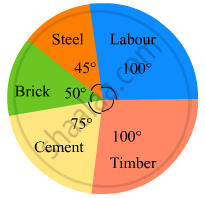
(i) Total cost of the flat.
(ii) Expenditure incurred on labour.
The following table shows the daily supply of electricity to different places in a town. To show the information by a pie diagram, measures of central angles of sectors are to be decided.
Complete the following activity to find the measure :
| Places |
Supply of electricity |
Measure of central angle |
| Roads | 4 | `4/30 xx 360 = 48^circ` |
| Factories | 12 | `square/square xx 360 = 144^circ` |
| shops | 6 | `6/30 xx 360 = square` |
| Houses | 8 | `square/square xx 360 = square` |
| Total ⇒ | 30 | `square` |
Medical check up of 180 women was conducted in a health centre in a village. 50 of them were short of haemoglobin, 10 suffered from cataract and 25 had respiratory disorders. The remaining women were healthy. Show the information by a pie diagram.
On an environment day, students in a school planted 120 trees under plantation project. The information regarding the project is shown in the following table. Show it by a pie diagram.
|
Tree name
|
Karanj | Behada | Arjun | Bakul | Kadunimb |
| No. of trees | 20 | 28 | 24 | 22 | 26 |
Write down the percentage of content in human body from the given pie-chart.
Draw a pie-chart for the favourite sweets of your family members
What is the central angle of the sector representing hormones enzymes and other proteins?

The pie chart on the right shows the result of a survey carried out to find the modes of travel used by the children to go to school. Study the pie chart and answer the questions that follow.
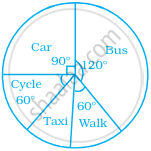
- What is the most common mode of transport?
- What fraction of children travel by car?
- If 18 children travel by car, how many children took part in the survey?
- How many children use taxi to travel to school?
- By which two modes of transport are equal number of children travelling?
For the development of basic infrastructure in a district, a project of Rs 108 crore approved by Development Bank is as follows:
| Item Head | Road | Electricity | Drinking water | Sewerage |
| Amount In crore (Rs.) |
43.2 | 16.2 | 27.00 | 21.6 |
Draw a pie chart for this data.
A survey was carried out to find the favourite beverage preferred by a certain group of young people. The following pie chart shows the findings of this survey.
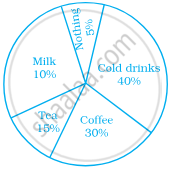
From this pie chart answer the following:
- Which type of beverage is liked by the maximum number of people.
- If 45 people like tea, how many people were surveyed?
