Advertisements
Advertisements
प्रश्न
The following pie diagram represents the sectorwise loan amount in crores of rupees distributed by a bank. From the information answer the following questions :
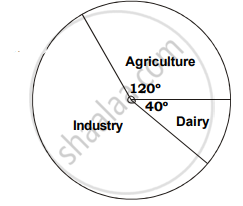
a. If the dairy sector receives `20 crores, then find the total loan disbursed.
b. Find the loan amount for agriculture sector and also for industrial sector.
c. How much additional amount did industrial sector receive than agriculture sector?
उत्तर
We compute the central angle for each crop as shown in the following table :
Central angle = `"Value of component"/"Total value of components" xx 100`
| Sector | Measure of central angle | Amount (in crores) |
| Agriculture | 120° | `120/360xx180=Rs.60` |
| Dairy | 40° | Rs.20 |
| Industry | 360-(120°+40°) =200 |
`200/360xx180=Rs.100` |
| Total | 360° | Rs.180 |
(a) the total loan disbursed for dairy sector :
Dairy sector receives Rs. 20 crores.
m of central ∠ for dairy = 40°
∴ Let total loan distribute for Dairy = x
∴ `x = [20 xx 360]/40 = 180`
Total loan disbursed for Diary is 180 crores.
(b) Total loan for the agriculaure sector :
`120/360xx180 = "Rs."60`
∴ the agriculture share = 60 crores.
(c) Total loan for industrial sector :
`200/360xx180="Rs."100`
∴ the Industrial sector share = 100 crores.
The additional amount the industrial sector received than the agriculture sector
= Rs.100 - Rs. 60
= Rs. 40 crores.
APPEARS IN
संबंधित प्रश्न
The sales of salesmen in a week are given in the pie diagram. Study the diagram and answer the following questions. If the total sale due to salesmen A is Rs. 18,000, then
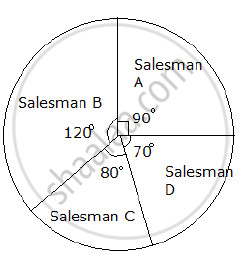
a) Find the total sale.
b) Find the sale of each salesman.
c) Find the salesman with the highest sale.
d) Find the difference between the highest sale and the lowest sale.
A group of 360 people were asked to vote for their favourite season from the three seasons rainy, winter and summer.
- Which season got the most votes?
- Find the central angle of each sector.
- Draw a pie chart to show this information.
| Season | No. of votes |
| Summer | 90 |
| Rainy | 120 |
| Winter | 150 |
The marks obtained by a student in different subjects are shown. Draw a pie diagram showing the information.
| Subject | English | Marathi | Science | Mathematics | Social science | Hindi |
| Marks | 50 | 70 | 80 | 90 | 60 | 50 |
The following table shows the percentages of demands for different fruits registered with a fruit vendor. Show the information by a pie diagram.
| Fruits | Mango | Sweet lime | Apples | Cheeku | Oranges |
| Percentages of demand | 30 | 15 | 25 | 20 | 10 |
The following table shows the expenditure incurred by a publisher in publishing a book:
| Items | Paper | Printing | Binding | Advertising | Miscellaneous |
| Expenditure (in%) | 35% | 20% | 10% | 5% | 30% |
Present the above data in the form of a pie-chart.
The following pie-chart shows the number of students admitted in different faculties of a college. If 1000 students are admitted in Science answer the following:
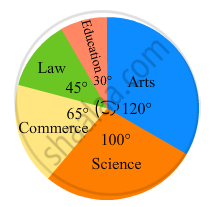
(i) What is the total number of students?
(ii) What is the ratio of students in science and arts?
Medical check up of 180 women was conducted in a health centre in a village. 50 of them were short of haemoglobin, 10 suffered from cataract and 25 had respiratory disorders. The remaining women were healthy. Show the information by a pie diagram.
Electricity used by farmers during different parts of a day for irrigation is as follows:
| Party of the day | Morning | Afternoon | Evening | Night |
| percentage of Electricity Used | 30 | 40 | 20 | 10 |
Draw a pie diagram to represent this information.
Write down the percentage of content in human body from the given pie-chart.
Absentees record of a class of 30 children is given in a graph.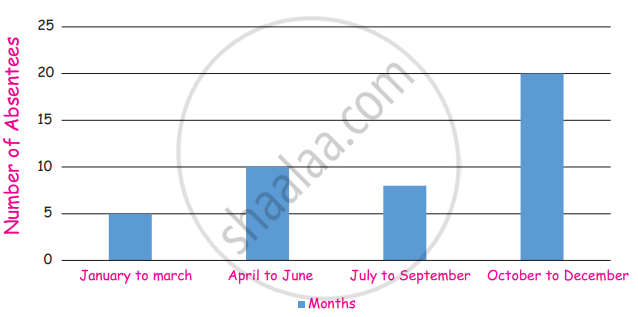
(i) In which month there are more absentees?
(ii) In which month there are less absentees?
Draw a pie-chart for the favourite sweets of your family members
A geometric representation showing the relationship between a whole and its parts is a ______.
Data collected in a survey shows that 40% of the buyers are interested in buying a particular brand of toothpaste. The central angle of the sector of the pie chart representing this information is ______.
Monthly salary of a person is Rs. 15000. The central angle of the sector representing his expenses on food and house rent on a pie chart is 60°. The amount he spends on food and house rent is ______.
Given below is a pie chart showing the time spend by a group of 350 children in different games. Observe it and answer the questions that follow:
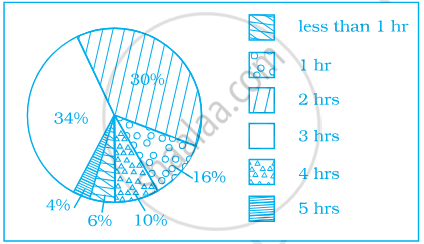
- How many children spend at least one hour in playing games?
- How many children spend more than 2 hours in playing games?
- How many children spend 3 or lesser hours in playing games?
- Which is greater — number of children who spend 2 hours or more per day or number of children who play for less than one hour?
Shoes of the following brands are sold in Nov. 2007 at a shoe store. Construct a pie chart for the data.
| Brand | Number of pair of shoes sold |
| A | 130 |
| B | 120 |
| C | 90 |
| D | 40 |
| E | 20 |
The following data represents the different number of animals in a zoo. Prepare a pie chart for the given data.
| Animals | Number of animals |
| Deer | 42 |
| Elephant | 15 |
| Giraffe | 26 |
| Reptiles | 24 |
| Tiger | 13 |
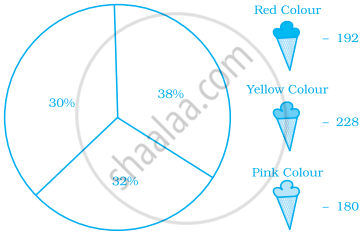
Identify which symbol should appear in each sector.
A financial counselor gave a client this pie chart describing how to budget his income. If the client brings home Rs. 50,000 each month, how much should he spend in each category?
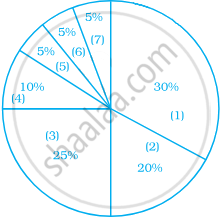
- Housing
- Food (including eating out)
- Car loan and Maintenance
- Utilities
- Phone
- Clothing
- Entertainment
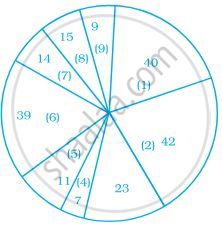
Following is a pie chart showing the amount spent in rupees (in thousands) by a company on various modes of advertising for a product.
Now answer the following questions.
- Which type of media advertising is the greatest amount of the total?
- Which type of media advertising is the least amount of the total?
- What percent of the total advertising amount is spent on direct mail campaigns?
- What percent of the advertising amount is spent on newspaper and magazine advertisements?
- What media types do you think are included in miscellaneous? Why aren’t those media types given their own category?
- Television
- Newspapers
- Magazines
- Radio
- Business papers
- Direct mail
- Yellow pages
- Outdoor
- Miscellaneous
