Advertisements
Advertisements
प्रश्न
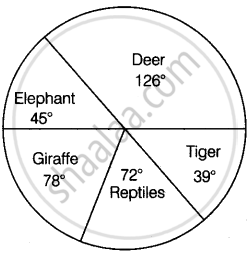
The following data represents the different number of animals in a zoo. Prepare a pie chart for the given data.
| Animals | Number of animals |
| Deer | 42 |
| Elephant | 15 |
| Giraffe | 26 |
| Reptiles | 24 |
| Tiger | 13 |
उत्तर
Total number of animals = 42 + 15 + 26 + 24 + 13 = 120
∴ Central angle made in pie chart for representing the animals like
(i) Deer = `42/120 xx 360^circ = 126^circ`
(ii) Elephant = `15/120 xx 360^circ = 45^circ`
(iii) Giraffe = `26/120 xx 360^circ = 78^circ`
(iv) Reptiles = `24/120 xx 360^circ = 72^circ`
(v) Tiger = `13/120 xx 360^circ = 39^circ`
APPEARS IN
संबंधित प्रश्न
A group of 360 people were asked to vote for their favourite season from the three seasons rainy, winter and summer.
- Which season got the most votes?
- Find the central angle of each sector.
- Draw a pie chart to show this information.
| Season | No. of votes |
| Summer | 90 |
| Rainy | 120 |
| Winter | 150 |
Draw a pie chart showing the following information. The table shows the colours preferred by a group of people.
| Colours | Number of people |
| Blue | 18 |
| Green | 9 |
| Red | 6 |
| Yellow | 3 |
| Total | 36 |
Find the proportion of each sector. For example, blue is `18/36 = 1.2` ; green is `9/36 = 1/4` and so on. Use this to find the corresponding angles.
The number of students in a hostel speaking different languages is given below. Display the data in a pie chart.
| Language | Hindi | English | Marathi | Tamil | Bengali | Total |
| Number of students | 40 | 12 | 9 | 7 | 4 | 72 |
The age group and number of persons, who donated blood in a blood donation camp is given below. Draw a pie diagram from it.
|
Age group (Yrs) |
20 - 25 |
25 - 30 |
30 - 35 |
35 - 40 |
|
No. of persons |
80 |
60 |
35 |
25 |
The following table shows the percentages of demands for different fruits registered with a fruit vendor. Show the information by a pie diagram.
| Fruits | Mango | Sweet lime | Apples | Cheeku | Oranges |
| Percentages of demand | 30 | 15 | 25 | 20 | 10 |
Draw a pie-diagram for the following data of expenditure pattern in a family:
| Items | Food | Clothing | Rent | Education | Unforeseen events | Midicine |
| Expenditure (in percent) | 40% | 20% | 10% | 10% | 15% | 5% |
The pie-chart given in the following shows the annual agricultural production of an Indian state. If the total production of all the commodities is 81000 tonnes, find the production (in tonnes) of
(i) Wheat
(ii) Sugar
(iii) Rice
(iv) Maize
(v) Gram

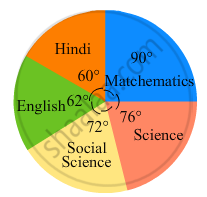
In the following figure, the pie-chart shows the marks obtained by a student in various subjects. If the student scored 135 marks in mathematics, find the total marks in all the subjects. Also, find his score in individual subjects.
The following pie-chart shows the monthly expenditure of Shikha on various items. If she spends Rs 16000 per month, answer the following questions:

(i) How much does she spend on rent?
(ii) How much does she spend on education?
(iii) What is the ratio of expenses on food and rent?
The following table shows the daily supply of electricity to different places in a town. To show the information by a pie diagram, measures of central angles of sectors are to be decided.
Complete the following activity to find the measure :
| Places |
Supply of electricity |
Measure of central angle |
| Roads | 4 | `4/30 xx 360 = 48^circ` |
| Factories | 12 | `square/square xx 360 = 144^circ` |
| shops | 6 | `6/30 xx 360 = square` |
| Houses | 8 | `square/square xx 360 = square` |
| Total ⇒ | 30 | `square` |
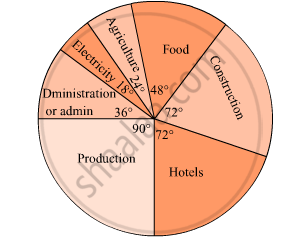
The pie diagram in figure shows the proportions of different workers in a town. Answer the following question with its help.
What is the percentage of workers in production ?
On an environment day, students in a school planted 120 trees under plantation project. The information regarding the project is shown in the following table. Show it by a pie diagram.
|
Tree name
|
Karanj | Behada | Arjun | Bakul | Kadunimb |
| No. of trees | 20 | 28 | 24 | 22 | 26 |
The number of varieties of ice creams in an ice cream parlour is given below as a pie-chart.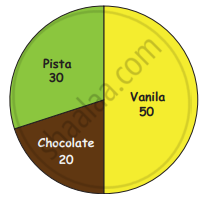
(i) How many varieties of Ice creams are there?
(ii) Find the number of Vanilla Ice creams ______.
(iii) Find the total number of Chocolate and Pista Ice cream _______.
(iv) Find the total number of Ice creams _______.
Absentees record of a class of 30 children is given in a graph.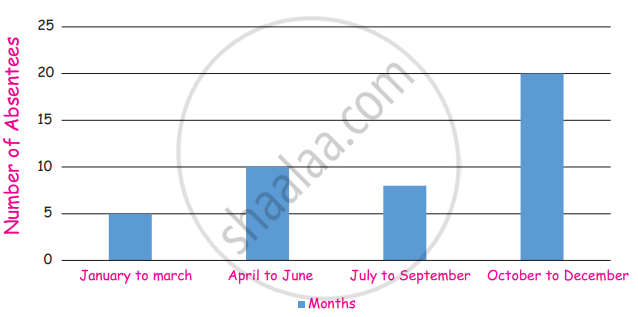
(i) In which month there are more absentees?
(ii) In which month there are less absentees?
In the EVS period, the teacher asked children whether they help their parents at home. There were different answers. Children named the work in which they help their parents the most. The teacher collected their answers and made a table.
| Help most in housework | Number of children |
| Going to the market | 47 |
| Washing utensils | 15 |
| Washing clothes | 3 |
| Marking serving food | 25 |
| Cleaning the house | 10 |
| Total children who said they help their parents |
Now you can fill the chapati chart to show the numbers given in the table.
Students of a class voted for their favourite colour and a pie chart was prepared based on the data collected.
Observe the pie chart given below and answer questions based on it.
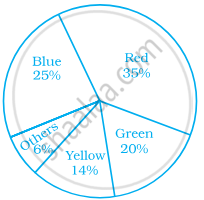
Which of the following is a reasonable conclusion for the given data?
The following pie chart represents the distribution of proteins in parts of a human body. What is the ratio of distribution of proteins in the muscles to that of proteins in the bones?

The pie chart on the right shows the result of a survey carried out to find the modes of travel used by the children to go to school. Study the pie chart and answer the questions that follow.
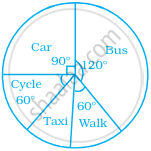
- What is the most common mode of transport?
- What fraction of children travel by car?
- If 18 children travel by car, how many children took part in the survey?
- How many children use taxi to travel to school?
- By which two modes of transport are equal number of children travelling?
