Advertisements
Advertisements
प्रश्न
The age group and number of persons, who donated blood in a blood donation camp is given below. Draw a pie diagram from it.
|
Age group (Yrs) |
20 - 25 |
25 - 30 |
30 - 35 |
35 - 40 |
|
No. of persons |
80 |
60 |
35 |
25 |
उत्तर
The measures of central angles are given in the table.
| Age group (Yrs) | No. of persons | Central Angle |
| 20 - 25 | 80 | \[\frac{80}{200} \times 360 = 144^\circ\] |
| 25 - 30 | 60 | \[\frac{60}{200} \times 360 = 108^\circ\] |
| 30 - 35 | 35 | \[\frac{35}{200} \times 360 = 63^\circ\] |
| 35 - 40 | 25 | \[\frac{25}{200} \times 360 = 45^\circ\] |
| Total | 200 |
The pie diagram showing the above data is given below:

संबंधित प्रश्न
The sales of salesmen in a week are given in the pie diagram. Study the diagram and answer the following questions. If the total sale due to salesmen A is Rs. 18,000, then
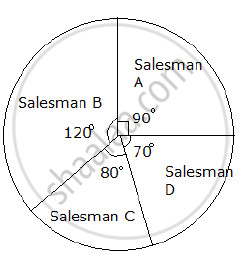
a) Find the total sale.
b) Find the sale of each salesman.
c) Find the salesman with the highest sale.
d) Find the difference between the highest sale and the lowest sale.
Draw a pie-diagram for the following data of expenditure pattern in a family:
| Items | Food | Clothing | Rent | Education | Unforeseen events | Midicine |
| Expenditure (in percent) | 40% | 20% | 10% | 10% | 15% | 5% |
The following data gives the amount spent on the construction of a house. Draw a pie diagram.
| Items | Cement | Timber | Bricks | Labour | Steel | Miscellaneous |
| Expenditure (in thousand Rs) |
60 | 30 | 45 | 75 | 45 | 45 |
Draw a pie-diagram representing the relative frequencies (expressed as percentage) of the eight classes as given below:
12.6, 18.2, 17.5, 20.3, 2.8, 4.2, 9.8, 14.7
The pie-chart given in the following represents the expenditure on different items in constructing a flat in Delhi. If the expenditure incurred on cement is Rs 112500, find the following:
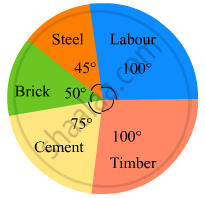
(i) Total cost of the flat.
(ii) Expenditure incurred on labour.
The pie-chart given in the following shows the annual agricultural production of an Indian state. If the total production of all the commodities is 81000 tonnes, find the production (in tonnes) of
(i) Wheat
(ii) Sugar
(iii) Rice
(iv) Maize
(v) Gram

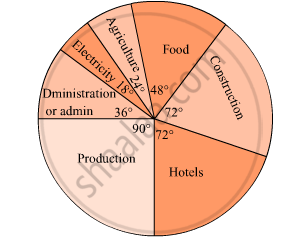
The pie diagram in figure shows the proportions of different workers in a town. Answer the following question with its help.
How many workers are working in the administration ?
Medical check up of 180 women was conducted in a health centre in a village. 50 of them were short of haemoglobin, 10 suffered from cataract and 25 had respiratory disorders. The remaining women were healthy. Show the information by a pie diagram.
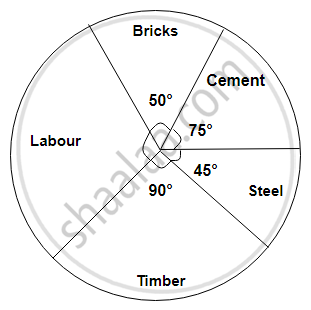
The following diagram represents expenditure on different items in constructing a building.
If the total construction cost of a building is Rs.540000, answer the following questions :
Find the central angle for labour expenditure.
Write down the percentage of content in human body from the given pie-chart.
Students of a class voted for their favourite colour and a pie chart was prepared based on the data collected.
Observe the pie chart given below and answer questions based on it.
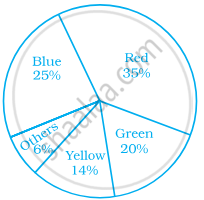
Which colour received `1/5` of the votes?
Students of a class voted for their favourite colour and a pie chart was prepared based on the data collected.
Observe the pie chart given below and answer questions based on it.
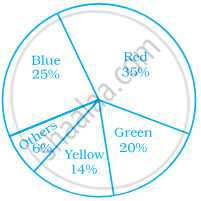
If 400 students voted in all, then how many did vote ‘Others’ colour as their favourite?
Data collected in a survey shows that 40% of the buyers are interested in buying a particular brand of toothpaste. The central angle of the sector of the pie chart representing this information is ______.
Sum of all the central angles in a pie chart is 360°.
Given below is a pie chart showing the time spend by a group of 350 children in different games. Observe it and answer the questions that follow:
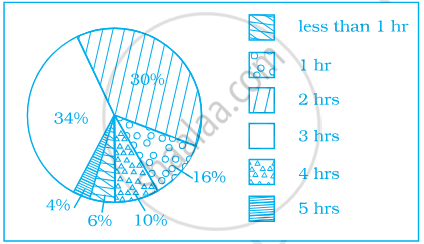
- How many children spend at least one hour in playing games?
- How many children spend more than 2 hours in playing games?
- How many children spend 3 or lesser hours in playing games?
- Which is greater — number of children who spend 2 hours or more per day or number of children who play for less than one hour?
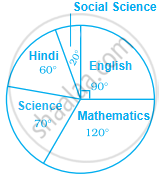
Study the pie chart given below depicting the marks scored by a student in an examination out of 540. Find the marks obtained by him in each subject.