Advertisements
Advertisements
प्रश्न
A geometric representation showing the relationship between a whole and its parts is a ______.
विकल्प
Pie chart
Histogram
Bar graph
Pictograph
उत्तर
A geometric representation showing the relationship between a whole and its parts is a pie chart.
Explanation:
A pie chart is a circular statistical graphic which is divided into slices to illustrate numerical proportion. The circle is taken as a whole and the slices are its part.
APPEARS IN
संबंधित प्रश्न
Area under different crops in a certain village is given below. Represent it by a pie diagram :
| Corps | Area (in Hectares) |
| Jowar | 80 |
| Wheat | 20 |
| Sugarcane | 60 |
| Vegetables | 20 |
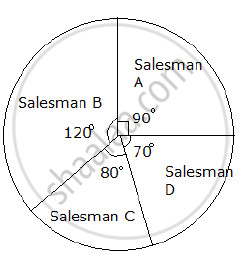
The sales of salesmen in a week are given in the pie diagram. Study the diagram and answer the following questions. If the total sale due to salesmen A is Rs. 18,000, then

a) Find the total sale.
b) Find the sale of each salesman.
c) Find the salesman with the highest sale.
d) Find the difference between the highest sale and the lowest sale.
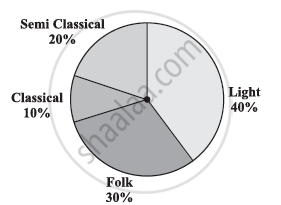
A survey was made to find the type of music that a certain group of young people liked in a city. Adjoining pie chart shows the findings of this survey.
From this pie chart answer the following:
- If 20 people liked classical music, how many young people were surveyed?
- Which type of music is liked by the maximum number of people?
- If a cassette company were to make 1000 CD’s, how many of each type would they make?

Draw a pie chart showing the following information. The table shows the colours preferred by a group of people.
| Colours | Number of people |
| Blue | 18 |
| Green | 9 |
| Red | 6 |
| Yellow | 3 |
| Total | 36 |
Find the proportion of each sector. For example, blue is `18/36 = 1.2` ; green is `9/36 = 1/4` and so on. Use this to find the corresponding angles.
The number of students in a hostel speaking different languages is given below. Display the data in a pie chart.
| Language | Hindi | English | Marathi | Tamil | Bengali | Total |
| Number of students | 40 | 12 | 9 | 7 | 4 | 72 |
The marks obtained by a student in different subjects are shown. Draw a pie diagram showing the information.
| Subject | English | Marathi | Science | Mathematics | Social science | Hindi |
| Marks | 50 | 70 | 80 | 90 | 60 | 50 |
In a tree plantation programme, the number of trees planted by students of different classes is given in the following table. Draw a pie diagram showing the information.
| Standard | 5th | 6th | 7th | 8th | 9th | 10th |
| No. of trees | 40 | 50 | 75 | 50 | 70 | 75 |
Find the correct answer from the alternatives given.
Different expenditures incurred on the construction of a building were shown by a pie diagram. The expenditure Rs 45,000 on cement was shown by a sector of central angle of 75°. What was the total expenditure of the construction ?
The number of hours, spent by a school boy on different activities in a working day, is given below:
| Activities | Sleep | School | Home | Play | Others | Total |
| Number of hours | 8 | 7 | 4 | 2 | 3 | 24 |
Present the information in the form of a pie-chart.
In one day the sales (in rupees) of different items of a baker's shop are given below:
| Items | Ordinary bread | Fruit bread | Cakes and Pastries | Biscuits | Others | Total |
| Sales (in Rs) | 260 | 40 | 100 | 60 | 20 | 480 |
Draw a pie-chart representing the above sales.
Percentage of the different products of a village in a particular district are given below. Draw a pie-chart representing this information.
| Items | Wheat | Pulses | Jwar | Grounnuts | Vegetables | Total |
| % | `125/3` | `125/6` | `25/2` | `50/3` | `25/3` | 100 |
Draw a pie-diagram of the areas of continents of the world given in the following table:
| Continents | Asia | U.S.S.R | Africa | Europe | Noth America | South America | Australia |
| Area (in million sq. km) |
26.9 | 20.5 | 30.3 | 4.9 | 24.3 | 17.9 | 8.5 |
The pie-chart given in the following represents the expenditure on different items in constructing a flat in Delhi. If the expenditure incurred on cement is Rs 112500, find the following:

(i) Total cost of the flat.
(ii) Expenditure incurred on labour.
The following pie-chart shows the monthly expenditure of Shikha on various items. If she spends Rs 16000 per month, answer the following questions:

(i) How much does she spend on rent?
(ii) How much does she spend on education?
(iii) What is the ratio of expenses on food and rent?
Collect information about the favorite pets of your classmates. Draw bar-graph and pie-chart for the same data
What is the central angle of the sector representing skin and bones together?

What is the central angle of the sector representing hormones enzymes and other proteins?

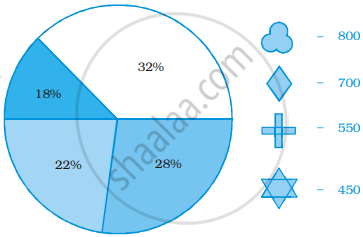
Identify which symbol should appear in each sector.

Identify which symbol should appear in each sector.

