Advertisements
Advertisements
प्रश्न
What is the central angle of the sector representing skin and bones together?

विकल्प
36°
60°
90°
96°
उत्तर
96°
Explanation:
Total protein in bones and skin = `1/6 + 1/10`
= `(3 + 5)/30`
= `8/30`
∴ Central angle of skin and bones = `8/30 xx 360^circ`
Central angle of the sector showing skin and bones together = 96°.
APPEARS IN
संबंधित प्रश्न
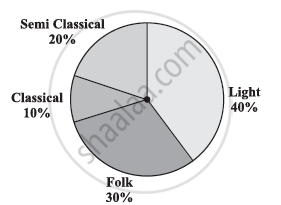
A survey was made to find the type of music that a certain group of young people liked in a city. Adjoining pie chart shows the findings of this survey.
From this pie chart answer the following:
- If 20 people liked classical music, how many young people were surveyed?
- Which type of music is liked by the maximum number of people?
- If a cassette company were to make 1000 CD’s, how many of each type would they make?
The age group and number of persons, who donated blood in a blood donation camp is given below. Draw a pie diagram from it.
|
Age group (Yrs) |
20 - 25 |
25 - 30 |
30 - 35 |
35 - 40 |
|
No. of persons |
80 |
60 |
35 |
25 |
The annual investments of a family are shown in the adjacent pie diagram. Answer the following questions based on it.
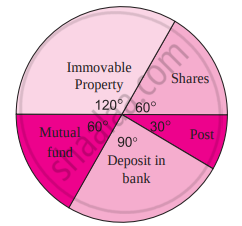
(1) If the investment in shares is ₹ 2000, find the total investment.
(2) How much amount is deposited in the bank?
(3) How much more money is invested in immovable property than in mutual fund?
(4) How much amount is invested in post?
The number of hours, spent by a school boy on different activities in a working day, is given below:
| Activities | Sleep | School | Home | Play | Others | Total |
| Number of hours | 8 | 7 | 4 | 2 | 3 | 24 |
Present the information in the form of a pie-chart.
The following data shows the expenditure of a person on different items during a month. Represent the data by a pie-chart.
| Items of expenditure | Rent | Education | Food | Clothing | Others |
| Amount (in Rs) | 2700 | 1800 | 2400 | 1500 | 2400 |
The following table shows how a student spends his pocket money during the course of a month. Represent it by a pie-diagram.
| Items | Food | Entertainment | Other expenditure | Savings |
| Expenditure | 40% | 25% | 20% | 15% |
Represent the following data by a pie-diagram:
| Items of expenditure | Expenditure | |
| Family A | Family B | |
| Food | 4000 | 6400 |
| Clothing | 2500 | 480 |
| Rent | 1500 | 3200 |
| Education | 400 | 1000 |
| Miscellaneous | 1600 | 600 |
| Total | 10000 | 16000 |
Following data gives the break up of the cost of production of a book:
| Printing | Paper | Binding charges | Advertisement | Royalty | Miscellaneous |
| 30% | 15% | 15% | 20% | 10% | 15% |
Draw a pie- diagram depicting the above information.
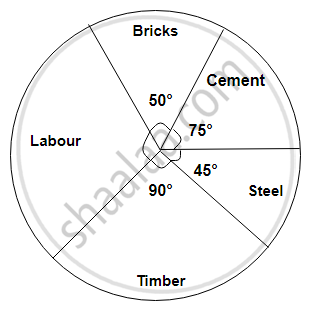
The pie-chart given in the following represents the expenditure on different items in constructing a flat in Delhi. If the expenditure incurred on cement is Rs 112500, find the following:
(i) Total cost of the flat.
(ii) Expenditure incurred on labour.
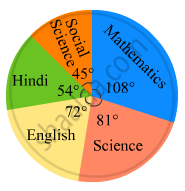
In the following figure, the pie-chart shows the marks obtained by a student in an examination. If the student secures 440 marks in all, calculate his marks in each of the given subjects.
The following table shows the daily supply of electricity to different places in a town. To show the information by a pie diagram, measures of central angles of sectors are to be decided.
Complete the following activity to find the measure :
| Places |
Supply of electricity |
Measure of central angle |
| Roads | 4 | `4/30 xx 360 = 48^circ` |
| Factories | 12 | `square/square xx 360 = 144^circ` |
| shops | 6 | `6/30 xx 360 = square` |
| Houses | 8 | `square/square xx 360 = square` |
| Total ⇒ | 30 | `square` |
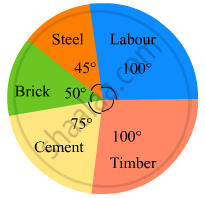
The following diagram represents expenditure on different items in constructing a building.
If the total construction cost of a building is Rs.540000, answer the following questions :
Find the expenditure on labour.
Subjective marks obtained by a student in an examination are given below:
| Subject | Marks |
| Marathi | 85 |
| English | 90 |
| Science | 85 |
| Mathematics | 100 |
| Total | 360 |
Draw a pie diagram to represent the above data.
| ordinary bread | 320 |
| fruit bread | 80 |
| cakes and pastries | 160 |
| biscuits | 120 |
| others | 40 |
|
Total
|
720 |
A geometric representation showing the relationship between a whole and its parts is a ______.
Students of a class voted for their favourite colour and a pie chart was prepared based on the data collected.
Observe the pie chart given below and answer questions based on it.
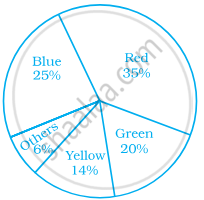
Which of the following is a reasonable conclusion for the given data?
Monthly salary of a person is Rs. 15000. The central angle of the sector representing his expenses on food and house rent on a pie chart is 60°. The amount he spends on food and house rent is ______.
What is the central angle of the sector representing hormones enzymes and other proteins?
A pie chart is used to compare ______ to a whole.
For the development of basic infrastructure in a district, a project of Rs 108 crore approved by Development Bank is as follows:
| Item Head | Road | Electricity | Drinking water | Sewerage |
| Amount In crore (Rs.) |
43.2 | 16.2 | 27.00 | 21.6 |
Draw a pie chart for this data.
