Advertisements
Advertisements
प्रश्न
What is the central angle of the sector representing skin and bones together?

पर्याय
36°
60°
90°
96°
उत्तर
96°
Explanation:
Total protein in bones and skin = `1/6 + 1/10`
= `(3 + 5)/30`
= `8/30`
∴ Central angle of skin and bones = `8/30 xx 360^circ`
Central angle of the sector showing skin and bones together = 96°.
APPEARS IN
संबंधित प्रश्न
Subjectwise marks obtained by a student in an examination are given below
| Subject | Marks |
| Marathi | 85 |
| Hindi | 85 |
| Science | 90 |
| Mathematics | 100 |
| Total | 360 |
Draw pie diagram
Area under different crops in a certain village is given below. Represent it by a pie diagram :
| Corps | Area (in Hectares) |
| Jowar | 80 |
| Wheat | 20 |
| Sugarcane | 60 |
| Vegetables | 20 |
A group of 360 people were asked to vote for their favourite season from the three seasons rainy, winter and summer.
- Which season got the most votes?
- Find the central angle of each sector.
- Draw a pie chart to show this information.
| Season | No. of votes |
| Summer | 90 |
| Rainy | 120 |
| Winter | 150 |
The number of students in a hostel speaking different languages is given below. Display the data in a pie chart.
| Language | Hindi | English | Marathi | Tamil | Bengali | Total |
| Number of students | 40 | 12 | 9 | 7 | 4 | 72 |
The age group and number of persons, who donated blood in a blood donation camp is given below. Draw a pie diagram from it.
|
Age group (Yrs) |
20 - 25 |
25 - 30 |
30 - 35 |
35 - 40 |
|
No. of persons |
80 |
60 |
35 |
25 |
The following data shows the expenditure of a person on different items during a month. Represent the data by a pie-chart.
| Items of expenditure | Rent | Education | Food | Clothing | Others |
| Amount (in Rs) | 2700 | 1800 | 2400 | 1500 | 2400 |
Draw a pie-diagram of the areas of continents of the world given in the following table:
| Continents | Asia | U.S.S.R | Africa | Europe | Noth America | South America | Australia |
| Area (in million sq. km) |
26.9 | 20.5 | 30.3 | 4.9 | 24.3 | 17.9 | 8.5 |
Represent the following data with the help of a pie-diagram:
| Items | Wheat | Rice | Tea |
| Production (in metric tons) | 3260 | 1840 | 900 |
The following pie-chart shows the number of students admitted in different faculties of a college. If 1000 students are admitted in Science answer the following:
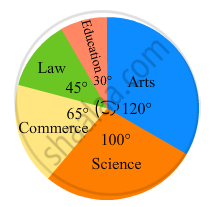
(i) What is the total number of students?
(ii) What is the ratio of students in science and arts?
The pie chart (as shown in the figure 25.23) represents the amount spent on different sports by a sports club in a year. If the total money spent by the club on sports is Rs 1,08,000, find the amount spent on each sport.

Medical check up of 180 women was conducted in a health centre in a village. 50 of them were short of haemoglobin, 10 suffered from cataract and 25 had respiratory disorders. The remaining women were healthy. Show the information by a pie diagram.
On an environment day, students in a school planted 120 trees under plantation project. The information regarding the project is shown in the following table. Show it by a pie diagram.
|
Tree name
|
Karanj | Behada | Arjun | Bakul | Kadunimb |
| No. of trees | 20 | 28 | 24 | 22 | 26 |
| ordinary bread | 320 |
| fruit bread | 80 |
| cakes and pastries | 160 |
| biscuits | 120 |
| others | 40 |
|
Total
|
720 |
A geometric representation showing the relationship between a whole and its parts is a ______.
In a pie chart, the total angle at the centre of the circle is ______.
Given below is a pie chart showing the time spend by a group of 350 children in different games. Observe it and answer the questions that follow:
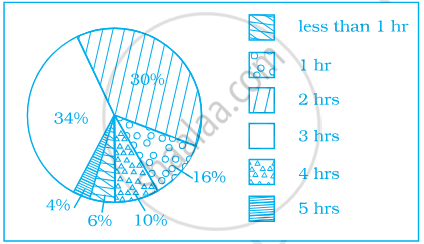
- How many children spend at least one hour in playing games?
- How many children spend more than 2 hours in playing games?
- How many children spend 3 or lesser hours in playing games?
- Which is greater — number of children who spend 2 hours or more per day or number of children who play for less than one hour?
The pie chart on the right shows the result of a survey carried out to find the modes of travel used by the children to go to school. Study the pie chart and answer the questions that follow.
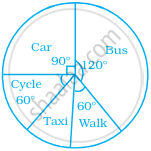
- What is the most common mode of transport?
- What fraction of children travel by car?
- If 18 children travel by car, how many children took part in the survey?
- How many children use taxi to travel to school?
- By which two modes of transport are equal number of children travelling?
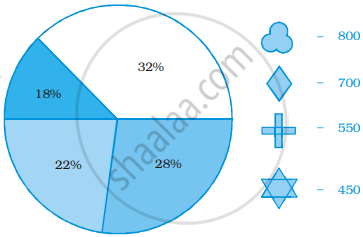
The following data represents the different number of animals in a zoo. Prepare a pie chart for the given data.
| Animals | Number of animals |
| Deer | 42 |
| Elephant | 15 |
| Giraffe | 26 |
| Reptiles | 24 |
| Tiger | 13 |
Identify which symbol should appear in each sector.
Following is a pie chart showing the amount spent in rupees (in thousands) by a company on various modes of advertising for a product.
Now answer the following questions.
- Which type of media advertising is the greatest amount of the total?
- Which type of media advertising is the least amount of the total?
- What percent of the total advertising amount is spent on direct mail campaigns?
- What percent of the advertising amount is spent on newspaper and magazine advertisements?
- What media types do you think are included in miscellaneous? Why aren’t those media types given their own category?
- Television
- Newspapers
- Magazines
- Radio
- Business papers
- Direct mail
- Yellow pages
- Outdoor
- Miscellaneous
