Topics
Linear equations in two variables
- Introduction to linear equations in two variables
- Methods of solving linear equations in two variables
- Simultaneous method
- Simultaneous method
- Substitution Method
- Cross - Multiplication Method
- Graphical Method
- Determinant method
- Determinant of Order Two
- Equations Reducible to a Pair of Linear Equations in Two Variables
- Simple Situational Problems
- Pair of Linear Equations in Two Variables
- Application of simultaneous equations
- Simultaneous method
Quadratic Equations
- Quadratic Equations
- Roots of a Quadratic Equation
- Solutions of Quadratic Equations by Factorization
- Solutions of Quadratic Equations by Completing the Square
- Formula for Solving a Quadratic Equation
- Nature of Roots of a Quadratic Equation
- The Relation Between Roots of the Quadratic Equation and Coefficients
- To Obtain a Quadratic Equation Having Given Roots
- Application of Quadratic Equation
Arithmetic Progression
- Introduction to Sequence
- Terms in a sequence
- Arithmetic Progression
- General Term of an Arithmetic Progression
- Sum of First ‘n’ Terms of an Arithmetic Progressions
- Arithmetic Progressions Examples and Solutions
- Geometric Progression
- General Term of an Geomatric Progression
- Sum of the First 'N' Terms of an Geometric Progression
- Geometric Mean
- Arithmetic Mean - Raw Data
- Concept of Ratio
Financial Planning
Probability
- Probability - A Theoretical Approach
- Basic Ideas of Probability
- Random Experiments
- Outcome
- Equally Likely Outcomes
- Sample Space
- Event and Its Types
- Probability of an Event
- Type of Event - Elementry
- Type of Event - Complementry
- Type of Event - Exclusive
- Type of Event - Exhaustive
- Concept Or Properties of Probability
- Addition Theorem
Statistics
- Tabulation of Data
- Inclusive and Exclusive Type of Tables
- Ogives (Cumulative Frequency Graphs)
- Applications of Ogives in Determination of Median
- Relation Between Measures of Central Tendency
- Introduction to Normal Distribution
- Properties of Normal Distribution
- Concepts of Statistics
- Mean of Grouped Data
- Method of Finding Mean for Grouped Data: Direct Method
- Method of Finding Mean for Grouped Data: Deviation Or Assumed Mean Method
- Method of Finding Mean for Grouped Data: the Step Deviation Method
- Median of Grouped Data
- Mode of Grouped Data
- Concept of Pictograph
- Presentation of Data
- Graphical Representation of Data as Histograms
- Frequency Polygon
- Concept of Pie Graph (Or a Circle-graph)
- Interpretation of Pie Diagram
- Drawing a Pie Graph
Definition
Pie graph(Or a Circle-graph): A pie-graph is used to compare parts of a whole. A circle graph shows the relationship between a whole and its part. Here, the whole circle is divided into sectors. The size of each sector is proportional to the activity or information it represents.
Notes
Pie graph(Or a Circle-graph):
-
A pie-graph is used to compare parts of a whole.
-
Data can also be presented using a circle graph or pie chart. A circle graph shows the relationship between a whole and its part. Here, the whole circle is divided into sectors. The size of each sector is proportional to the activity or information it represents.
The following pie graph shows the percentage of viewers watching different types of TV channels.
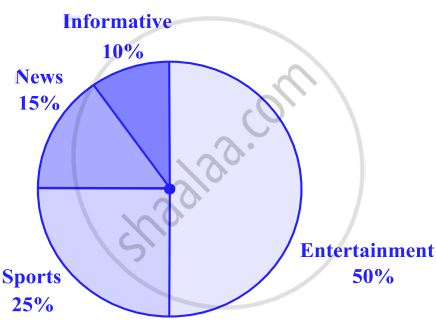
Drawing pie charts:
1) The favourite flavours of ice-creams for students of a school are given in percentages as follows.
Flavours |
Percentage of students
|
|
Chocolate |
50% |
| Vanilla |
25% |
|
Other flavours |
25% |
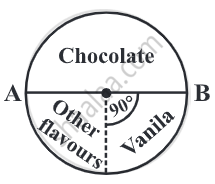
Let us represent this data in a pie chart.
The total angle at the centre of a circle is 360°. The central angle of the sectors will be a fraction of 360°. We make a table to find the central angle of the sectors.
Flavours |
Students in percent preferring the flavours |
In fractions |
Fraction of 360° |
| Chocolate | 50% | `50/100 = 1/2` | `1/2 "of" 360° =180°` |
| Vanilla | 25% | `25/100 = 1/4` | `1/4 "of" 360° = 90°` |
| Other flavours | 25% | `25/100 = 1/4` | `1/4 "of" 360° = 90°` |
- Draw a circle with any convenient radius. Mark its centre (O) and a radius (OA).
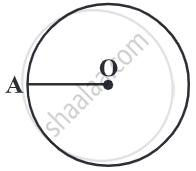
-
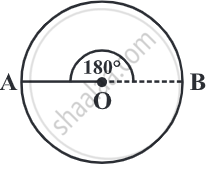
The angle of the sector for chocolate is 180°. Use the protractor to draw ∠AOB = 180°.
- Continue marking the remaining sectors.
Example
| ordinary bread | 320 |
| fruit bread | 80 |
| cakes and pastries | 160 |
| biscuits | 120 |
| others | 40 |
|
Total
|
720 |
| Item | Sales (In Rs.) | In Fraction | Central Angle |
| Ordinary Bread | 320 | `320/720 = 4/9` | `4/9xx360° = 160°` |
| Fruit Bread | 80 | `80/720 = 1/9` | `1/9xx360° = 40°` |
| Cakes and pastries | 160 | `160/720 = 2/9` | `2/9xx360° = 80°` |
| Biscuits | 120 | `120/720 = 1/6` | `1/6xx360° = 60°` |
| Others | 40 | `40/720 = 1/18` | `1/18xx360° = 20°` |

Video Tutorials
Shaalaa.com | Drawing Pie Charts
Related QuestionsVIEW ALL [102]
Subjectwise marks obtained by a student in an examination are given below
| Subject | Marks |
| Marathi | 85 |
| Hindi | 85 |
| Science | 90 |
| Mathematics | 100 |
| Total | 360 |
Draw pie diagram


