Advertisements
Advertisements
प्रश्न
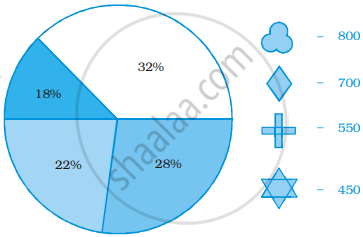
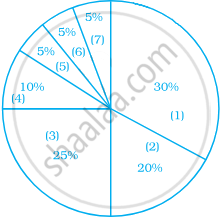
Identify which symbol should appear in each sector.
उत्तर
From the given figure,
Total number of symbol = 800 + 700 + 550 + 450 = 2500
Then,
(i) `32/100 xx 2500 = 800`
∴  symbol should appear in sector having 32%.
(ii) `28/100 xx 2500 = 700`
∴  symbol should appear in sector having 28%.
(iii) `22/100 xx 2500 = 550`
∴  symbol should appear in sector having 22%.
(iv) `18/100 xx 2500 = 450`
∴  symbol should appear in sector having 18%.
APPEARS IN
संबंधित प्रश्न
The number of students in a hostel speaking different languages is given below. Display the data in a pie chart.
| Language | Hindi | English | Marathi | Tamil | Bengali | Total |
| Number of students | 40 | 12 | 9 | 7 | 4 | 72 |
The marks obtained by a student in an examination out of 100 are given below. The total marks obtained in various subjects are as follows:
| Subject | Marks |
| Marathi | 85 |
| English | 85 |
| Science | 90 |
| Mathematics | 100 |
| Total | 360 |
Represent the above data using pie diagram
The age group and number of persons, who donated blood in a blood donation camp is given below. Draw a pie diagram from it.
|
Age group (Yrs) |
20 - 25 |
25 - 30 |
30 - 35 |
35 - 40 |
|
No. of persons |
80 |
60 |
35 |
25 |
The marks obtained by a student in different subjects are shown. Draw a pie diagram showing the information.
| Subject | English | Marathi | Science | Mathematics | Social science | Hindi |
| Marks | 50 | 70 | 80 | 90 | 60 | 50 |
The pie diagram in figure shows the proportions of different workers in a town. Answer the following question with its help.
If the total workers is 10,000; how many of them are in the field of construction ?
The following table shows the expenditure incurred by a publisher in publishing a book:
| Items | Paper | Printing | Binding | Advertising | Miscellaneous |
| Expenditure (in%) | 35% | 20% | 10% | 5% | 30% |
Present the above data in the form of a pie-chart.
Percentage of the different products of a village in a particular district are given below. Draw a pie-chart representing this information.
| Items | Wheat | Pulses | Jwar | Grounnuts | Vegetables | Total |
| % | `125/3` | `125/6` | `25/2` | `50/3` | `25/3` | 100 |
The pie-chart given in the following represents the expenditure on different items in constructing a flat in Delhi. If the expenditure incurred on cement is Rs 112500, find the following:

(i) Total cost of the flat.
(ii) Expenditure incurred on labour.
Area under different crops in a certain village is given below. Represent it by pie diagram:
| Crop | Area (in hectare) |
| Jowar | 8000 |
| Wheat | 6000 |
| Sugarcane | 2000 |
| Vegetable | 2000 |
The marks obtained by a student in an examination are given below:
| Subject | Marks |
| Marathi | 85 |
| Hindi | 80 |
| English | 95 |
| Mathematics | 100 |
| Total | 360 |
Represent the data using pie diagram.
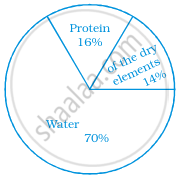
Write down the percentage of content in human body from the given pie-chart.
Absentees record of a class of 30 children is given in a graph.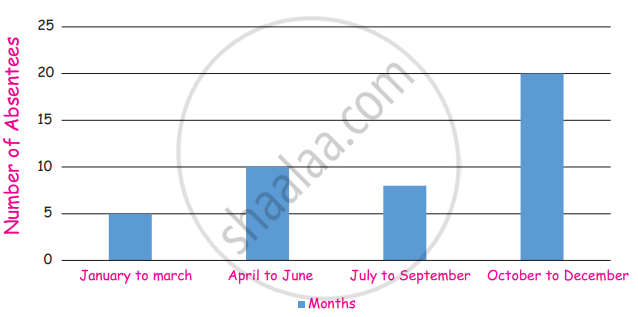
(i) In which month there are more absentees?
(ii) In which month there are less absentees?
Draw a pie-chart for the favourite sweets of your family members
A geometric representation showing the relationship between a whole and its parts is a ______.
The following pie chart gives the distribution of constituents in the human body. The central angle of the sector showing the distribution of protein and other constituents is ______.
What is the central angle of the sector representing skin and bones together?

In a pie chart a whole circle is divided into sectors.
Given below is a pie chart showing the time spend by a group of 350 children in different games. Observe it and answer the questions that follow:
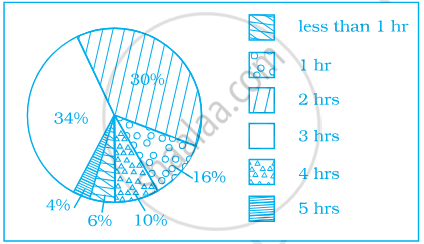
- How many children spend at least one hour in playing games?
- How many children spend more than 2 hours in playing games?
- How many children spend 3 or lesser hours in playing games?
- Which is greater — number of children who spend 2 hours or more per day or number of children who play for less than one hour?
In the time table of a school, periods allotted per week to different teaching subjects are given below:
| Subject | Hindi | English | Maths | Science | Social Science |
Computer | Sanskrit |
| Periods Allotted |
7 | 8 | 8 | 8 | 7 | 4 | 3 |
Draw a pie chart for this data.
A financial counselor gave a client this pie chart describing how to budget his income. If the client brings home Rs. 50,000 each month, how much should he spend in each category?
- Housing
- Food (including eating out)
- Car loan and Maintenance
- Utilities
- Phone
- Clothing
- Entertainment
