Advertisements
Advertisements
प्रश्न
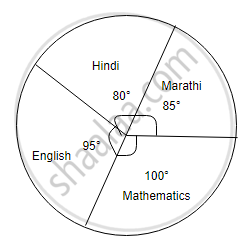
The marks obtained by a student in an examination are given below:
| Subject | Marks |
| Marathi | 85 |
| Hindi | 80 |
| English | 95 |
| Mathematics | 100 |
| Total | 360 |
Represent the data using pie diagram.
उत्तर
| Subject | Marks | Q = Measure of a central angle |
| Marathi | 85 | 85 |
| Hindi | 80 | 80 |
| English | 95 | 95 |
| Mathematics | 100 | 100 |
| Total | 360 | 360 |
APPEARS IN
संबंधित प्रश्न
Area under different crops in a certain village is given below. Represent it by a pie diagram :
| Corps | Area (in Hectares) |
| Jowar | 80 |
| Wheat | 20 |
| Sugarcane | 60 |
| Vegetables | 20 |
The marks obtained by a student in different subjects are shown. Draw a pie diagram showing the information.
| Subject | English | Marathi | Science | Mathematics | Social science | Hindi |
| Marks | 50 | 70 | 80 | 90 | 60 | 50 |
In a tree plantation programme, the number of trees planted by students of different classes is given in the following table. Draw a pie diagram showing the information.
| Standard | 5th | 6th | 7th | 8th | 9th | 10th |
| No. of trees | 40 | 50 | 75 | 50 | 70 | 75 |
The following table shows the expenditure incurred by a publisher in publishing a book:
| Items | Paper | Printing | Binding | Advertising | Miscellaneous |
| Expenditure (in%) | 35% | 20% | 10% | 5% | 30% |
Present the above data in the form of a pie-chart.
Percentage of the different products of a village in a particular district are given below. Draw a pie-chart representing this information.
| Items | Wheat | Pulses | Jwar | Grounnuts | Vegetables | Total |
| % | `125/3` | `125/6` | `25/2` | `50/3` | `25/3` | 100 |
The following table shows how a student spends his pocket money during the course of a month. Represent it by a pie-diagram.
| Items | Food | Entertainment | Other expenditure | Savings |
| Expenditure | 40% | 25% | 20% | 15% |
Represent the following data by a pie-diagram:
| Items of expenditure | Expenditure | |
| Family A | Family B | |
| Food | 4000 | 6400 |
| Clothing | 2500 | 480 |
| Rent | 1500 | 3200 |
| Education | 400 | 1000 |
| Miscellaneous | 1600 | 600 |
| Total | 10000 | 16000 |
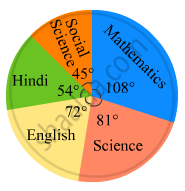
In the following figure, the pie-chart shows the marks obtained by a student in an examination. If the student secures 440 marks in all, calculate his marks in each of the given subjects.
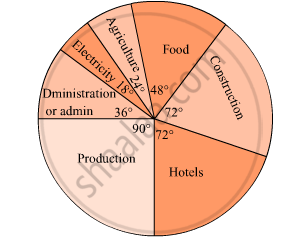
The pie diagram in figure shows the proportions of different workers in a town. Answer the following question with its help.
What is the percentage of workers in production ?
Area under different crops in a certain village is given below. Represent it by pie diagram:
| Crop | Area (in hectare) |
| Jowar | 8000 |
| Wheat | 6000 |
| Sugarcane | 2000 |
| Vegetable | 2000 |
Absentees record of a class of 30 children is given in a graph.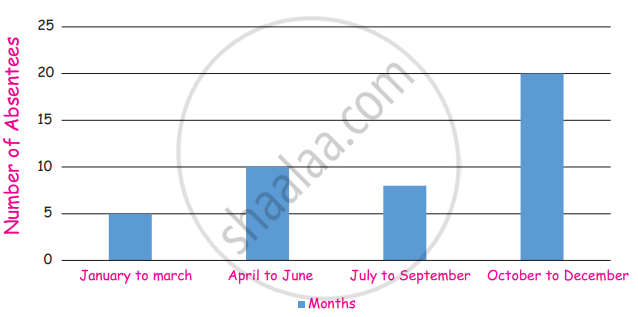
(i) In which month there are more absentees?
(ii) In which month there are less absentees?
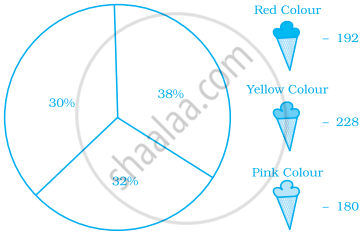
Students of a class voted for their favourite colour and a pie chart was prepared based on the data collected.
Observe the pie chart given below and answer questions based on it.
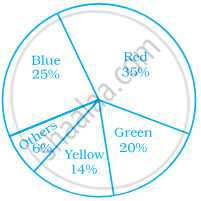
If 400 students voted in all, then how many did vote ‘Others’ colour as their favourite?
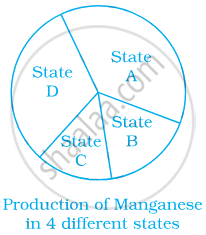
From the given pie chart, we can infer that production of Manganese is least in state B.
The following pie chart depicts the expenditure of a state government under different heads.
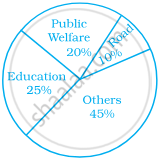
- If the total spending is 10 crores, how much money was spent on roads?
- How many times is the amount of money spent on education compared to the amount spent on roads?
- What fraction of the total expenditure is spent on both roads and public welfare together?
For the development of basic infrastructure in a district, a project of Rs 108 crore approved by Development Bank is as follows:
| Item Head | Road | Electricity | Drinking water | Sewerage |
| Amount In crore (Rs.) |
43.2 | 16.2 | 27.00 | 21.6 |
Draw a pie chart for this data.
The following data represents the approximate percentage of water in various oceans. Prepare a pie chart for the given data.
| Pacific | 40% |
| Atlantic | 30% |
| Indian | 20% |
| Others | 10% |
Identify which symbol should appear in each sector.
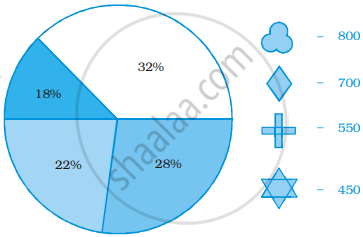
Identify which symbol should appear in each sector.