Advertisements
Advertisements
प्रश्न
Absentees record of a class of 30 children is given in a graph.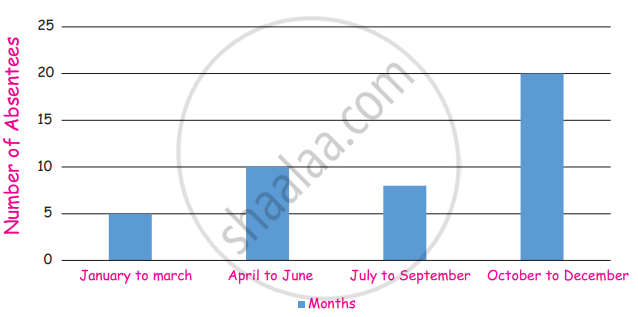
(i) In which month there are more absentees?
(ii) In which month there are less absentees?
उत्तर
(i) October to December since It will be winter season.
(ii) January to March Since Annual Exam comes.
APPEARS IN
संबंधित प्रश्न
The pie diagram in figure shows the proportions of different workers in a town. Answer the following question with its help.
If the total workers is 10,000; how many of them are in the field of construction ?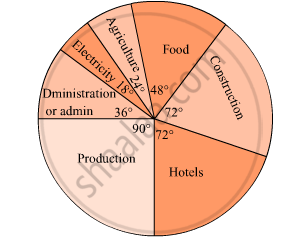
The following table shows the percentages of vehicles passing a signal. Find out the measures of central angle to show the information by a pie diagram and hence draw the pie diagram.
| Type of Vehicle | Bicycle | Two wheeler | Car | Bus | Rickshaw |
| Percentage | 10 | 30 | 20 | 20 | 20 |
The pie-chart given in the following shows the annual agricultural production of an Indian state. If the total production of all the commodities is 81000 tonnes, find the production (in tonnes) of
(i) Wheat
(ii) Sugar
(iii) Rice
(iv) Maize
(v) Gram

The following pie-chart shows the number of students admitted in different faculties of a college. If 1000 students are admitted in Science answer the following:
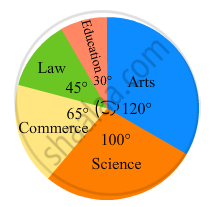
(i) What is the total number of students?
(ii) What is the ratio of students in science and arts?
The following pie-chart shows the monthly expenditure of Shikha on various items. If she spends Rs 16000 per month, answer the following questions:

(i) How much does she spend on rent?
(ii) How much does she spend on education?
(iii) What is the ratio of expenses on food and rent?
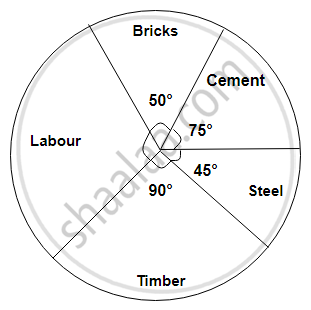
The following diagram represents expenditure on different items in constructing a building.
If the total construction cost of a building is Rs.540000, answer the following questions :
Find the central angle for labour expenditure.
Write down the percentage of content in human body from the given pie-chart.
Students of a class voted for their favourite colour and a pie chart was prepared based on the data collected.
Observe the pie chart given below and answer questions based on it.
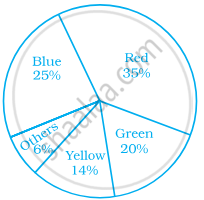
Which colour received `1/5` of the votes?
Given below is a pie chart showing the time spend by a group of 350 children in different games. Observe it and answer the questions that follow:
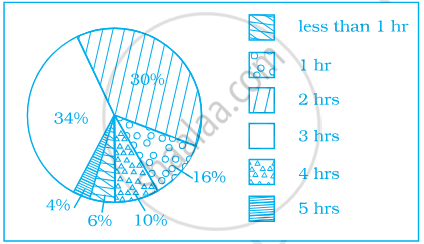
- How many children spend at least one hour in playing games?
- How many children spend more than 2 hours in playing games?
- How many children spend 3 or lesser hours in playing games?
- Which is greater — number of children who spend 2 hours or more per day or number of children who play for less than one hour?
The following data represents the different number of animals in a zoo. Prepare a pie chart for the given data.
| Animals | Number of animals |
| Deer | 42 |
| Elephant | 15 |
| Giraffe | 26 |
| Reptiles | 24 |
| Tiger | 13 |
