Advertisements
Advertisements
प्रश्न
In a pie chart a whole circle is divided into sectors.
पर्याय
True
False
उत्तर
This statement is True.
Explanation:
A pie chart is a type of graph in which a circle is divided into sectors that each represents a proportion of the whole.
APPEARS IN
संबंधित प्रश्न
Subjectwise marks obtained by a student in an examination are given below
| Subject | Marks |
| Marathi | 85 |
| Hindi | 85 |
| Science | 90 |
| Mathematics | 100 |
| Total | 360 |
Draw pie diagram
A group of 360 people were asked to vote for their favourite season from the three seasons rainy, winter and summer.
- Which season got the most votes?
- Find the central angle of each sector.
- Draw a pie chart to show this information.
| Season | No. of votes |
| Summer | 90 |
| Rainy | 120 |
| Winter | 150 |
Find the correct answer from the alternatives given.
Different expenditures incurred on the construction of a building were shown by a pie diagram. The expenditure Rs 45,000 on cement was shown by a sector of central angle of 75°. What was the total expenditure of the construction ?
Employees of a company have been categorized according to their religions as given below:
| Religions | Hindu | Muslim | Sikh | Christian | Total |
| Number of workers | 420 | 300 | 225 | 105 | 1080 |
Draw a pie-chart to represent the above information.
The following data gives the amount spent on the construction of a house. Draw a pie diagram.
| Items | Cement | Timber | Bricks | Labour | Steel | Miscellaneous |
| Expenditure (in thousand Rs) |
60 | 30 | 45 | 75 | 45 | 45 |
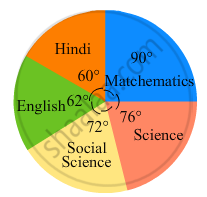
In the following figure, the pie-chart shows the marks obtained by a student in various subjects. If the student scored 135 marks in mathematics, find the total marks in all the subjects. Also, find his score in individual subjects.
The number of hours, spent by a school boy in different activities in a day is given below :
| Activity | Sleep | School | Play | Homework | Others | Total |
| Number of Hours | 7 | 7 | 2 | 4 | 4 | 24 |
Represent the above information using a pie diagram.
The marks obtained by a student in an examination are given below:
| Subject | Marks |
| Marathi | 85 |
| Hindi | 80 |
| English | 95 |
| Mathematics | 100 |
| Total | 360 |
Represent the data using pie diagram.
| ordinary bread | 320 |
| fruit bread | 80 |
| cakes and pastries | 160 |
| biscuits | 120 |
| others | 40 |
|
Total
|
720 |
The number of varieties of ice creams in an ice cream parlour is given below as a pie-chart.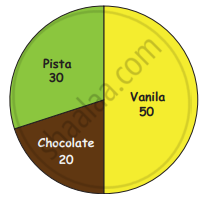
(i) How many varieties of Ice creams are there?
(ii) Find the number of Vanilla Ice creams ______.
(iii) Find the total number of Chocolate and Pista Ice cream _______.
(iv) Find the total number of Ice creams _______.
| Age group (in years) |
No. of Persons | Measure of central angle |
| 20 – 25 | 80 | `square/200 xx 360^circ = square` |
| 25 – 30 | 60 | `60/200 xx 360^circ = square` |
| 30 – 35 | 35 | `35/200 xx square = 63^circ` |
| 35 – 40 | 25 | `25/200 xx 360^circ = square` |
| Total | 200 | `square` |
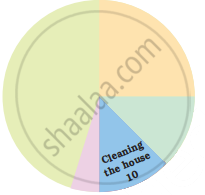
In the EVS period, the teacher asked children whether they help their parents at home. There were different answers. Children named the work in which they help their parents the most. The teacher collected their answers and made a table.
| Help most in housework | Number of children |
| Going to the market | 47 |
| Washing utensils | 15 |
| Washing clothes | 3 |
| Marking serving food | 25 |
| Cleaning the house | 10 |
| Total children who said they help their parents |
Now you can fill the chapati chart to show the numbers given in the table.
Look and find out
Children who help in making or serving food are
A geometric representation showing the relationship between a whole and its parts is a ______.
A pie chart is used to compare ______ to a whole.
In a pie chart two central angles can be of 180°.
In a pie chart two or more central angles can be equal.
For the development of basic infrastructure in a district, a project of Rs 108 crore approved by Development Bank is as follows:
| Item Head | Road | Electricity | Drinking water | Sewerage |
| Amount In crore (Rs.) |
43.2 | 16.2 | 27.00 | 21.6 |
Draw a pie chart for this data.
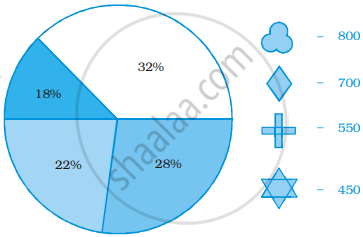
Identify which symbol should appear in each sector.