Advertisements
Advertisements
प्रश्न
Find the correct answer from the alternatives given.
Different expenditures incurred on the construction of a building were shown by a pie diagram. The expenditure Rs 45,000 on cement was shown by a sector of central angle of 75°. What was the total expenditure of the construction ?
पर्याय
2,16,000
3,60,000
4,50,000
7,50,000
उत्तर
Central angle for expenditures incurred on the construction = 75°
\[ \Rightarrow\text{ Total expenditures }= 45000 \times \frac{360^\circ}{75^\circ}\]
= Rs 216000
APPEARS IN
संबंधित प्रश्न
Subjectwise marks obtained by a student in an examination are given below
| Subject | Marks |
| Marathi | 85 |
| Hindi | 85 |
| Science | 90 |
| Mathematics | 100 |
| Total | 360 |
Draw pie diagram
Area under different crops in a certain village is given below. Represent it by a pie diagram :
| Corps | Area (in Hectares) |
| Jowar | 80 |
| Wheat | 20 |
| Sugarcane | 60 |
| Vegetables | 20 |
The age group and number of persons, who donated blood in a blood donation camp is given below. Draw a pie diagram from it.
|
Age group (Yrs) |
20 - 25 |
25 - 30 |
30 - 35 |
35 - 40 |
|
No. of persons |
80 |
60 |
35 |
25 |
The marks obtained by a student in different subjects are shown. Draw a pie diagram showing the information.
| Subject | English | Marathi | Science | Mathematics | Social science | Hindi |
| Marks | 50 | 70 | 80 | 90 | 60 | 50 |
In one day the sales (in rupees) of different items of a baker's shop are given below:
| Items | Ordinary bread | Fruit bread | Cakes and Pastries | Biscuits | Others | Total |
| Sales (in Rs) | 260 | 40 | 100 | 60 | 20 | 480 |
Draw a pie-chart representing the above sales.
The following table shows how a student spends his pocket money during the course of a month. Represent it by a pie-diagram.
| Items | Food | Entertainment | Other expenditure | Savings |
| Expenditure | 40% | 25% | 20% | 15% |
Following is the break up of the expenditure of a family on different items of consumption:
| Items | Food | Clothing | Rent | Education | Fuel etc. | Medicine | Miscellaneous |
| Expenditure (in Rs) | 1600 | 200 | 600 | 150 | 100 | 80 | 270 |
Draw a pie-diagram to represent the above data.
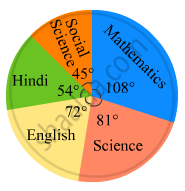
In the following figure, the pie-chart shows the marks obtained by a student in an examination. If the student secures 440 marks in all, calculate his marks in each of the given subjects.
The following table shows the daily supply of electricity to different places in a town. To show the information by a pie diagram, measures of central angles of sectors are to be decided.
Complete the following activity to find the measure :
| Places |
Supply of electricity |
Measure of central angle |
| Roads | 4 | `4/30 xx 360 = 48^circ` |
| Factories | 12 | `square/square xx 360 = 144^circ` |
| shops | 6 | `6/30 xx 360 = square` |
| Houses | 8 | `square/square xx 360 = square` |
| Total ⇒ | 30 | `square` |
The following table shows causes of noise pollution. Show it by a pie diagram.
|
Construction
|
Traffic | Aircraft take offs | Industry | Trains |
| 10% | 50% | 9% | 20% | 11% |
Subjective marks obtained by a student in an examination are given below:
| Subject | Marks |
| Marathi | 85 |
| English | 90 |
| Science | 85 |
| Mathematics | 100 |
| Total | 360 |
Draw a pie diagram to represent the above data.
The number of hours, spent by a school boy in different activities in a day is given below :
| Activity | Sleep | School | Play | Homework | Others | Total |
| Number of Hours | 7 | 7 | 2 | 4 | 4 | 24 |
Represent the above information using a pie diagram.
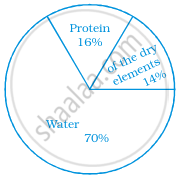
The following pie chart gives the distribution of constituents in the human body. The central angle of the sector showing the distribution of protein and other constituents is ______.
The following pie chart represents the distribution of proteins in parts of a human body. What is the ratio of distribution of proteins in the muscles to that of proteins in the bones?

Data represented using circles is known as ______.
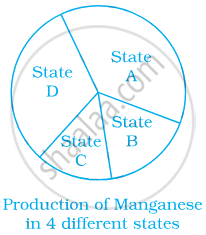
From the given pie chart, we can infer that production of Manganese is least in state B.
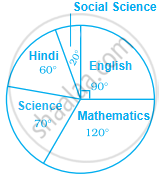
Study the pie chart given below depicting the marks scored by a student in an examination out of 540. Find the marks obtained by him in each subject.
Identify which symbol should appear in each sector.
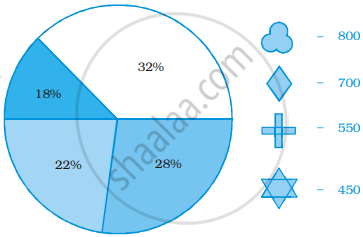
Identify which symbol should appear in each sector.
Following is a pie chart showing the amount spent in rupees (in thousands) by a company on various modes of advertising for a product.
Now answer the following questions.
- Which type of media advertising is the greatest amount of the total?
- Which type of media advertising is the least amount of the total?
- What percent of the total advertising amount is spent on direct mail campaigns?
- What percent of the advertising amount is spent on newspaper and magazine advertisements?
- What media types do you think are included in miscellaneous? Why aren’t those media types given their own category?
- Television
- Newspapers
- Magazines
- Radio
- Business papers
- Direct mail
- Yellow pages
- Outdoor
- Miscellaneous
