Advertisements
Advertisements
प्रश्न
| Age group (in years) |
No. of Persons | Measure of central angle |
| 20 – 25 | 80 | `square/200 xx 360^circ = square` |
| 25 – 30 | 60 | `60/200 xx 360^circ = square` |
| 30 – 35 | 35 | `35/200 xx square = 63^circ` |
| 35 – 40 | 25 | `25/200 xx 360^circ = square` |
| Total | 200 | `square` |
उत्तर
| Age group (in years) |
No. of Persons | Measure of central angle |
| 20 – 25 | 80 | `bb80/200 xx 360^circ = bb(144^circ)` |
| 25 – 30 | 60 | `60/200 xx 360^circ = bb(108^circ)` |
| 30 – 35 | 35 | `35/200 xx bb(360^circ) = 63^circ` |
| 35 – 40 | 25 | `25/200 xx 360^circ = bb(45^circ)` |
| Total | 200 | `bb(360^circ)` |
APPEARS IN
संबंधित प्रश्न
Subjectwise marks obtained by a student in an examination are given below
| Subject | Marks |
| Marathi | 85 |
| Hindi | 85 |
| Science | 90 |
| Mathematics | 100 |
| Total | 360 |
Draw pie diagram
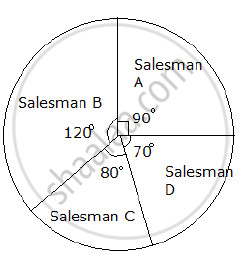
The sales of salesmen in a week are given in the pie diagram. Study the diagram and answer the following questions. If the total sale due to salesmen A is Rs. 18,000, then

a) Find the total sale.
b) Find the sale of each salesman.
c) Find the salesman with the highest sale.
d) Find the difference between the highest sale and the lowest sale.
The marks obtained by a student in an examination out of 100 are given below. The total marks obtained in various subjects are as follows:
| Subject | Marks |
| Marathi | 85 |
| English | 85 |
| Science | 90 |
| Mathematics | 100 |
| Total | 360 |
Represent the above data using pie diagram
The marks obtained by a student in different subjects are shown. Draw a pie diagram showing the information.
| Subject | English | Marathi | Science | Mathematics | Social science | Hindi |
| Marks | 50 | 70 | 80 | 90 | 60 | 50 |
In a tree plantation programme, the number of trees planted by students of different classes is given in the following table. Draw a pie diagram showing the information.
| Standard | 5th | 6th | 7th | 8th | 9th | 10th |
| No. of trees | 40 | 50 | 75 | 50 | 70 | 75 |
The following table shows the expenditure incurred by a publisher in publishing a book:
| Items | Paper | Printing | Binding | Advertising | Miscellaneous |
| Expenditure (in%) | 35% | 20% | 10% | 5% | 30% |
Present the above data in the form of a pie-chart.
Percentage of the different products of a village in a particular district are given below. Draw a pie-chart representing this information.
| Items | Wheat | Pulses | Jwar | Grounnuts | Vegetables | Total |
| % | `125/3` | `125/6` | `25/2` | `50/3` | `25/3` | 100 |
The following data gives the amount spent on the construction of a house. Draw a pie diagram.
| Items | Cement | Timber | Bricks | Labour | Steel | Miscellaneous |
| Expenditure (in thousand Rs) |
60 | 30 | 45 | 75 | 45 | 45 |
Represent the following data with the help of a pie-diagram:
| Items | Wheat | Rice | Tea |
| Production (in metric tons) | 3260 | 1840 | 900 |
Draw a pie-diagram representing the relative frequencies (expressed as percentage) of the eight classes as given below:
12.6, 18.2, 17.5, 20.3, 2.8, 4.2, 9.8, 14.7
The pie diagram in figure shows the proportions of different workers in a town. Answer the following question with its help.
How many workers are working in the administration ?

The pie diagram in figure shows the proportions of different workers in a town. Answer the following question with its help.
What is the percentage of workers in production ?

Draw a pie-chart for the favourite sweets of your family members
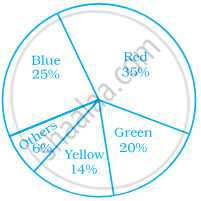
Students of a class voted for their favourite colour and a pie chart was prepared based on the data collected.
Observe the pie chart given below and answer questions based on it.

If 400 students voted in all, then how many did vote ‘Others’ colour as their favourite?
The following pie chart represents the distribution of proteins in parts of a human body. What is the ratio of distribution of proteins in the muscles to that of proteins in the bones?

Study the pie chart given below depicting the marks scored by a student in an examination out of 540. Find the marks obtained by him in each subject.

Shoes of the following brands are sold in Nov. 2007 at a shoe store. Construct a pie chart for the data.
| Brand | Number of pair of shoes sold |
| A | 130 |
| B | 120 |
| C | 90 |
| D | 40 |
| E | 20 |
In a district, the number of branches of different banks is given below:
| Bank | State Bank of India |
Bank of Baroda |
Punjab National Bank |
Canara Bank |
| Number of Branches | 30 | 17 | 15 | 10 |
Draw a pie chart for this data.
For the development of basic infrastructure in a district, a project of Rs 108 crore approved by Development Bank is as follows:
| Item Head | Road | Electricity | Drinking water | Sewerage |
| Amount In crore (Rs.) |
43.2 | 16.2 | 27.00 | 21.6 |
Draw a pie chart for this data.
