Advertisements
Advertisements
प्रश्न
In a pie chart two central angles can be of 180°.
पर्याय
True
False
उत्तर
This statement is True.
Explanation:
The sum of all central angles of a pie chart does not exceed 360°.
∵ 180° + 180° = 360° ...(i.e., it does not exceed 360°)
Therefore, two central angles can be of 180°.
APPEARS IN
संबंधित प्रश्न
The following pie diagram represents the sectorwise loan amount in crores of rupees distributed by a bank. From the information answer the following questions :
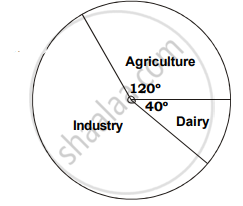
a. If the dairy sector receives `20 crores, then find the total loan disbursed.
b. Find the loan amount for agriculture sector and also for industrial sector.
c. How much additional amount did industrial sector receive than agriculture sector?
The following table shows the percentages of vehicles passing a signal. Find out the measures of central angle to show the information by a pie diagram and hence draw the pie diagram.
| Type of Vehicle | Bicycle | Two wheeler | Car | Bus | Rickshaw |
| Percentage | 10 | 30 | 20 | 20 | 20 |
The number of hours, spent by a school boy on different activities in a working day, is given below:
| Activities | Sleep | School | Home | Play | Others | Total |
| Number of hours | 8 | 7 | 4 | 2 | 3 | 24 |
Present the information in the form of a pie-chart.
The percentages of various categories of workers in a state are given in the following table.
| Categoies | Culti-vators | Agricultural Labourers | Industrial Workers | Commercial Workers | Others |
| % of workers | 40 | 25 | 12.5 | 10 | 12.5 |
Present the information in the form a pie-chart.
The following table shows the expenditure incurred by a publisher in publishing a book:
| Items | Paper | Printing | Binding | Advertising | Miscellaneous |
| Expenditure (in%) | 35% | 20% | 10% | 5% | 30% |
Present the above data in the form of a pie-chart.
Percentage of the different products of a village in a particular district are given below. Draw a pie-chart representing this information.
| Items | Wheat | Pulses | Jwar | Grounnuts | Vegetables | Total |
| % | `125/3` | `125/6` | `25/2` | `50/3` | `25/3` | 100 |
Draw a pie-diagram for the following data of the investment pattern in a five year plan:
| Agriculture | Irrigation and Power | Small Industries | Transport | Social service | Miscellaneous |
| 14% | 16% | 29% | 17% | 16% | 8% |
The pie-chart given in the following represents the expenditure on different items in constructing a flat in Delhi. If the expenditure incurred on cement is Rs 112500, find the following:
(i) Total cost of the flat.
(ii) Expenditure incurred on labour.
The following pie-chart shows the monthly expenditure of Shikha on various items. If she spends Rs 16000 per month, answer the following questions:

(i) How much does she spend on rent?
(ii) How much does she spend on education?
(iii) What is the ratio of expenses on food and rent?
Area under different crops in a certain village is given below. Represent it by pie diagram:
| Crop | Area (in hectare) |
| Jowar | 8000 |
| Wheat | 6000 |
| Sugarcane | 2000 |
| Vegetable | 2000 |
The marks obtained by a student in an examination are given below:
| Subject | Marks |
| Marathi | 85 |
| Hindi | 80 |
| English | 95 |
| Mathematics | 100 |
| Total | 360 |
Represent the data using pie diagram.
| ordinary bread | 320 |
| fruit bread | 80 |
| cakes and pastries | 160 |
| biscuits | 120 |
| others | 40 |
|
Total
|
720 |
In a pie chart, the total angle at the centre of the circle is ______.
Monthly salary of a person is Rs. 15000. The central angle of the sector representing his expenses on food and house rent on a pie chart is 60°. The amount he spends on food and house rent is ______.
A pie chart is used to compare ______ to a whole.
Sum of all the central angles in a pie chart is 360°.
In a pie chart two or more central angles can be equal.
