Advertisements
Advertisements
प्रश्न
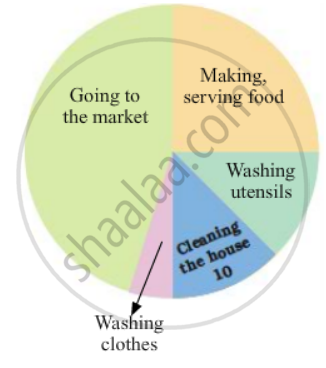
In the EVS period, the teacher asked children whether they help their parents at home. There were different answers. Children named the work in which they help their parents the most. The teacher collected their answers and made a table.
| Help most in housework | Number of children |
| Going to the market | 47 |
| Washing utensils | 15 |
| Washing clothes | 3 |
| Marking serving food | 25 |
| Cleaning the house | 10 |
| Total children who said they help their parents |
Now you can fill the chapati chart to show the numbers given in the table.
उत्तर
| Help most in housework | Number of children |
| Going to the market | 47 |
| Washing utensils | 15 |
| Washing clothes | 3 |
| Marking serving food | 25 |
| Cleaning the house | 10 |
| Total children who said they help their parents | 100 |
Total number of children who said they help their parents
= 47 + 15 + 3 + 25 + 10
= 100
The chapati chart is shown below:
APPEARS IN
संबंधित प्रश्न
The annual investments of a family are shown in the adjacent pie diagram. Answer the following questions based on it.
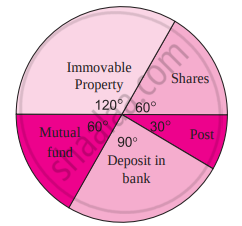
(1) If the investment in shares is ₹ 2000, find the total investment.
(2) How much amount is deposited in the bank?
(3) How much more money is invested in immovable property than in mutual fund?
(4) How much amount is invested in post?
Find the correct answer from the alternatives given.
The persons of O - blood group are 40%. The classification of persons based on blood groups is to be shown by a pie diagram. What should be the measures of angle for the persons of O - blood group?
The following table shows the percentages of vehicles passing a signal. Find out the measures of central angle to show the information by a pie diagram and hence draw the pie diagram.
| Type of Vehicle | Bicycle | Two wheeler | Car | Bus | Rickshaw |
| Percentage | 10 | 30 | 20 | 20 | 20 |
Draw a pie-diagram for the following data of the investment pattern in a five year plan:
| Agriculture | Irrigation and Power | Small Industries | Transport | Social service | Miscellaneous |
| 14% | 16% | 29% | 17% | 16% | 8% |
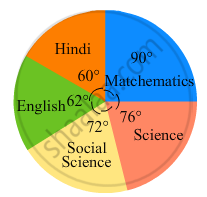
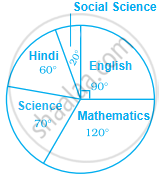
In the following figure, the pie-chart shows the marks obtained by a student in various subjects. If the student scored 135 marks in mathematics, find the total marks in all the subjects. Also, find his score in individual subjects.
The number of varieties of ice creams in an ice cream parlour is given below as a pie-chart.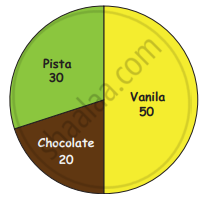
(i) How many varieties of Ice creams are there?
(ii) Find the number of Vanilla Ice creams ______.
(iii) Find the total number of Chocolate and Pista Ice cream _______.
(iv) Find the total number of Ice creams _______.
A pie chart is used to compare ______ to a whole.
Study the pie chart given below depicting the marks scored by a student in an examination out of 540. Find the marks obtained by him in each subject.
In a district, the number of branches of different banks is given below:
| Bank | State Bank of India |
Bank of Baroda |
Punjab National Bank |
Canara Bank |
| Number of Branches | 30 | 17 | 15 | 10 |
Draw a pie chart for this data.
For the development of basic infrastructure in a district, a project of Rs 108 crore approved by Development Bank is as follows:
| Item Head | Road | Electricity | Drinking water | Sewerage |
| Amount In crore (Rs.) |
43.2 | 16.2 | 27.00 | 21.6 |
Draw a pie chart for this data.
