Advertisements
Advertisements
प्रश्न
The annual investments of a family are shown in the adjacent pie diagram. Answer the following questions based on it.

(1) If the investment in shares is ₹ 2000, find the total investment.
(2) How much amount is deposited in the bank?
(3) How much more money is invested in immovable property than in mutual fund?
(4) How much amount is invested in post?
उत्तर
Measure of central angle (θ) = `"Number of scores in the components"/"Total number of scores" × 360°`
(1) Central angle for shares (θ) = 60°
∴ 60° = `"Amount invested in shares"/"Total investment" × 360°`
∴ 60° = `2000/"Total investment" × 360°`
∴ Total investment = `(2000 × 360°)/(60°) = ₹ 12000`
The total investment is Rs. 12000.
(2) Central angle for deposit in bank (θ) = 90°
∴ 90° = `"Amount deposited in bank"/"Total investment" × 360°`
∴ 90° = `"Amount deposited in bank"/12000 × 360°`
∴ Amount deposited in bank = `(90° × 12000)/(360°) = ₹ 3000`
∴ The amount deposited in bank is Rs. 3000.
(3) Difference in central angle for immovable property and mutual fund (θ) = 120° – 60° = 60°
∴ 60° = `"Difference in investments"/"12000" × 360°`
∴ Difference in investments = `(60° × 12000)/(360°)` = ₹ 2000
∴ Rs. 2000 more is invested in immovable property than in mutual fund.
संबंधित प्रश्न
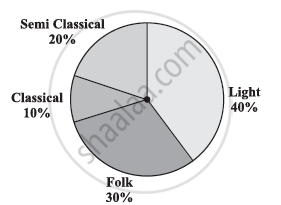
A survey was made to find the type of music that a certain group of young people liked in a city. Adjoining pie chart shows the findings of this survey.
From this pie chart answer the following:
- If 20 people liked classical music, how many young people were surveyed?
- Which type of music is liked by the maximum number of people?
- If a cassette company were to make 1000 CD’s, how many of each type would they make?

Draw a pie chart showing the following information. The table shows the colours preferred by a group of people.
| Colours | Number of people |
| Blue | 18 |
| Green | 9 |
| Red | 6 |
| Yellow | 3 |
| Total | 36 |
Find the proportion of each sector. For example, blue is `18/36 = 1.2` ; green is `9/36 = 1/4` and so on. Use this to find the corresponding angles.
The marks obtained by a student in different subjects are shown. Draw a pie diagram showing the information.
| Subject | English | Marathi | Science | Mathematics | Social science | Hindi |
| Marks | 50 | 70 | 80 | 90 | 60 | 50 |
In a tree plantation programme, the number of trees planted by students of different classes is given in the following table. Draw a pie diagram showing the information.
| Standard | 5th | 6th | 7th | 8th | 9th | 10th |
| No. of trees | 40 | 50 | 75 | 50 | 70 | 75 |
The number of hours, spent by a school boy on different activities in a working day, is given below:
| Activities | Sleep | School | Home | Play | Others | Total |
| Number of hours | 8 | 7 | 4 | 2 | 3 | 24 |
Present the information in the form of a pie-chart.
The following data gives the amount spent on the construction of a house. Draw a pie diagram.
| Items | Cement | Timber | Bricks | Labour | Steel | Miscellaneous |
| Expenditure (in thousand Rs) |
60 | 30 | 45 | 75 | 45 | 45 |
Following is the break up of the expenditure of a family on different items of consumption:
| Items | Food | Clothing | Rent | Education | Fuel etc. | Medicine | Miscellaneous |
| Expenditure (in Rs) | 1600 | 200 | 600 | 150 | 100 | 80 | 270 |
Draw a pie-diagram to represent the above data.
In the following figure, the pie-chart shows the marks obtained by a student in various subjects. If the student scored 135 marks in mathematics, find the total marks in all the subjects. Also, find his score in individual subjects.

The pie diagram in figure shows the proportions of different workers in a town. Answer the following question with its help.
What is the percentage of workers in production ?

| ordinary bread | 320 |
| fruit bread | 80 |
| cakes and pastries | 160 |
| biscuits | 120 |
| others | 40 |
|
Total
|
720 |
Draw a pie-chart for the favourite sweets of your family members
A geometric representation showing the relationship between a whole and its parts is a ______.
Rahul, Varun and Yash are playing a game of spinning a coloured wheel. Rahul wins if spinner lands on red. Varun wins if spinner lands on blue and Yash wins if it lands on green. Which of the following spinner should be used to make the game fair?
What is the central angle of the sector representing skin and bones together?

In a pie chart two or more central angles can be equal.
Shoes of the following brands are sold in Nov. 2007 at a shoe store. Construct a pie chart for the data.
| Brand | Number of pair of shoes sold |
| A | 130 |
| B | 120 |
| C | 90 |
| D | 40 |
| E | 20 |
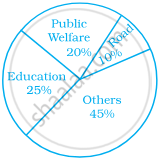
The following pie chart depicts the expenditure of a state government under different heads.

- If the total spending is 10 crores, how much money was spent on roads?
- How many times is the amount of money spent on education compared to the amount spent on roads?
- What fraction of the total expenditure is spent on both roads and public welfare together?
For the development of basic infrastructure in a district, a project of Rs 108 crore approved by Development Bank is as follows:
| Item Head | Road | Electricity | Drinking water | Sewerage |
| Amount In crore (Rs.) |
43.2 | 16.2 | 27.00 | 21.6 |
Draw a pie chart for this data.
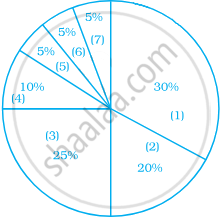
A financial counselor gave a client this pie chart describing how to budget his income. If the client brings home Rs. 50,000 each month, how much should he spend in each category?

- Housing
- Food (including eating out)
- Car loan and Maintenance
- Utilities
- Phone
- Clothing
- Entertainment
