Advertisements
Advertisements
Question
The annual investments of a family are shown in the adjacent pie diagram. Answer the following questions based on it.

(1) If the investment in shares is ₹ 2000, find the total investment.
(2) How much amount is deposited in the bank?
(3) How much more money is invested in immovable property than in mutual fund?
(4) How much amount is invested in post?
Solution
Measure of central angle (θ) = `"Number of scores in the components"/"Total number of scores" × 360°`
(1) Central angle for shares (θ) = 60°
∴ 60° = `"Amount invested in shares"/"Total investment" × 360°`
∴ 60° = `2000/"Total investment" × 360°`
∴ Total investment = `(2000 × 360°)/(60°) = ₹ 12000`
The total investment is Rs. 12000.
(2) Central angle for deposit in bank (θ) = 90°
∴ 90° = `"Amount deposited in bank"/"Total investment" × 360°`
∴ 90° = `"Amount deposited in bank"/12000 × 360°`
∴ Amount deposited in bank = `(90° × 12000)/(360°) = ₹ 3000`
∴ The amount deposited in bank is Rs. 3000.
(3) Difference in central angle for immovable property and mutual fund (θ) = 120° – 60° = 60°
∴ 60° = `"Difference in investments"/"12000" × 360°`
∴ Difference in investments = `(60° × 12000)/(360°)` = ₹ 2000
∴ Rs. 2000 more is invested in immovable property than in mutual fund.
RELATED QUESTIONS
Subjectwise marks obtained by a student in an examination are given below
| Subject | Marks |
| Marathi | 85 |
| Hindi | 85 |
| Science | 90 |
| Mathematics | 100 |
| Total | 360 |
Draw pie diagram
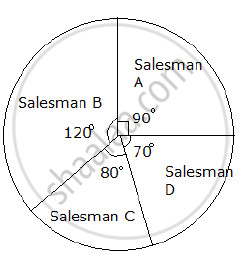
The sales of salesmen in a week are given in the pie diagram. Study the diagram and answer the following questions. If the total sale due to salesmen A is Rs. 18,000, then

a) Find the total sale.
b) Find the sale of each salesman.
c) Find the salesman with the highest sale.
d) Find the difference between the highest sale and the lowest sale.
Employees of a company have been categorized according to their religions as given below:
| Religions | Hindu | Muslim | Sikh | Christian | Total |
| Number of workers | 420 | 300 | 225 | 105 | 1080 |
Draw a pie-chart to represent the above information.
In one day the sales (in rupees) of different items of a baker's shop are given below:
| Items | Ordinary bread | Fruit bread | Cakes and Pastries | Biscuits | Others | Total |
| Sales (in Rs) | 260 | 40 | 100 | 60 | 20 | 480 |
Draw a pie-chart representing the above sales.
The following data shows the expenditure of a person on different items during a month. Represent the data by a pie-chart.
| Items of expenditure | Rent | Education | Food | Clothing | Others |
| Amount (in Rs) | 2700 | 1800 | 2400 | 1500 | 2400 |
Draw a pie-diagram for the following data of expenditure pattern in a family:
| Items | Food | Clothing | Rent | Education | Unforeseen events | Midicine |
| Expenditure (in percent) | 40% | 20% | 10% | 10% | 15% | 5% |
Observe the adjacent pie diagram. It shows the percentages of number of vehicles passing a signal in a town between 8 am and 10 am
(1) Find the central angle for each type of vehicle.
(2) If the number of two-wheelers is 1200, find the number of all vehicles.

The following diagram represents expenditure on different items in constructing a building.
If the total construction cost of a building is Rs.540000, answer the following questions :
Find the central angle for labour expenditure.

Subjective marks obtained by a student in an examination are given below:
| Subject | Marks |
| Marathi | 85 |
| English | 90 |
| Science | 85 |
| Mathematics | 100 |
| Total | 360 |
Draw a pie diagram to represent the above data.
Write down the percentage of content in human body from the given pie-chart.
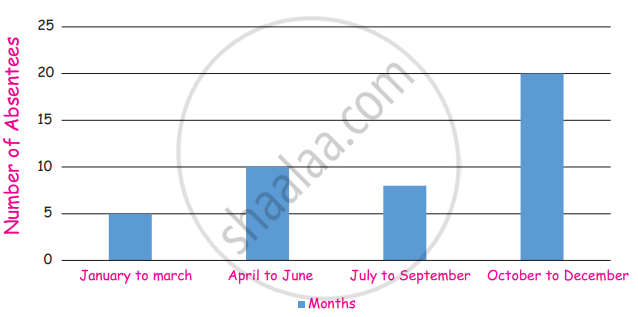
Absentees record of a class of 30 children is given in a graph.
(i) In which month there are more absentees?
(ii) In which month there are less absentees?
Students of a class voted for their favourite colour and a pie chart was prepared based on the data collected.
Observe the pie chart given below and answer questions based on it.

Which colour received `1/5` of the votes?
The following pie chart represents the distribution of proteins in parts of a human body. What is the ratio of distribution of proteins in the muscles to that of proteins in the bones?

In a pie chart a whole circle is divided into sectors.
The following data represents the different number of animals in a zoo. Prepare a pie chart for the given data.
| Animals | Number of animals |
| Deer | 42 |
| Elephant | 15 |
| Giraffe | 26 |
| Reptiles | 24 |
| Tiger | 13 |
In a district, the number of branches of different banks is given below:
| Bank | State Bank of India |
Bank of Baroda |
Punjab National Bank |
Canara Bank |
| Number of Branches | 30 | 17 | 15 | 10 |
Draw a pie chart for this data.
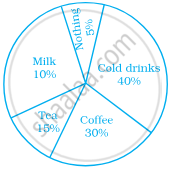
A survey was carried out to find the favourite beverage preferred by a certain group of young people. The following pie chart shows the findings of this survey.

From this pie chart answer the following:
- Which type of beverage is liked by the maximum number of people.
- If 45 people like tea, how many people were surveyed?
The following data represents the approximate percentage of water in various oceans. Prepare a pie chart for the given data.
| Pacific | 40% |
| Atlantic | 30% |
| Indian | 20% |
| Others | 10% |
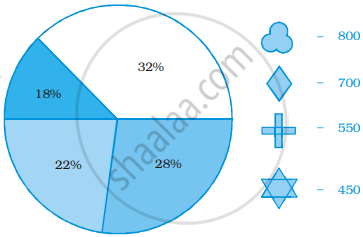
Identify which symbol should appear in each sector.

