Advertisements
Online Mock Tests
Chapters
![Balbharati solutions for Algebra (Mathematics 1) [English] Standard 10 Maharashtra State Board chapter 6 - Statistics - Shaalaa.com](/images/algebra-mathematics-1-english-standard-10-maharashtra-state-board_6:3c1a2739ef74455990da08f3e1b1d605.png "Balbharati solutions for Algebra (Mathematics 1) [English] Standard 10 Maharashtra State Board chapter 6 - Statistics")
Advertisements
Solutions for Chapter 6: Statistics
Below listed, you can find solutions for Chapter 6 of Maharashtra State Board Balbharati for Algebra (Mathematics 1) [English] Standard 10 Maharashtra State Board.
Balbharati solutions for Algebra (Mathematics 1) [English] Standard 10 Maharashtra State Board 6 Statistics Practice Set 6.1 [Page 138]
The following table shows the number of students and the time they utilized daily for their studies. Find the mean time spent by students for their studies by direct method.
| Time (hrs.) | 0-2 | 2-4 | 4-6 | 6-8 | 8-10 |
| No. of students | 7 | 18 | 12 | 10 | 3 |
In the following table, the toll (in ₹) paid by drivers and the number of vehicles is shown. Find the mean of the toll by 'assumed mean' method.
| Toll (Rupees) | 300 - 400 | 400 - 500 | 500 - 600 | 600 - 700 | 700 - 800 |
| No. of vehicles | 80 | 110 | 120 | 70 | 40 |
A milk centre sold milk to 50 customers. The table below gives the number of customers and the milk they purchased. Find the mean of the milk sold by direct method.
| Milk Sold (Litre) | 1 – 2 | 2 – 3 | 3 – 4 | 4 – 5 | 5 – 6 |
| No. of Customers | 17 | 13 | 10 | 7 | 3 |
A frequency distribution table for the production of oranges of some farm owners is given below. Find the mean production of oranges by ‘assumed mean’ method.
|
Production (Thousand rupees)
|
25-30 | 30-35 | 35-40 | 40-45 | 45-50 |
| No. of Customers | 20 | 25 | 15 | 10 | 10 |
A frequency distribution of funds collected by 120 workers in a company for the drought affected people are given in the following table. Find the mean of the funds by ‘step deviation’ method.
|
Fund (Rupees)
|
0-500 | 500-1000 | 1000-1500 | 1500-2000 | 2000-2500 |
| No. of workers | 35 | 28 | 32 | 15 | 10 |
The following table gives the information of frequency distribution of weekly wages of 150 workers of a company. Find the mean of the weekly wages by 'step deviation' method.
|
Weekly wages (Rupees)
|
1000 - 2000 | 2000 - 3000 | 3000 - 4000 | 4000 - 5000 |
| No. of workers | 25 | 45 | 50 | 30 |
Balbharati solutions for Algebra (Mathematics 1) [English] Standard 10 Maharashtra State Board 6 Statistics Practice Set 6.2 [Pages 145 - 146]
The following table shows classification of number of workers and the number of hours they work in a software company. Find the median of the number of hours they work.
| Daily No. of hours | 8 - 10 | 10 - 12 | 12 - 14 | 14 - 16 |
| Number of workers | 150 | 500 | 300 | 50 |
The frequency distribution table shows the number of mango trees in a grove and their yield of mangoes. Find the median of data.
| No. of Mangoes | 50 - 100 | 100 - 150 | 150 - 200 | 200 - 250 | 250 - 300 |
| No. of trees | 33 | 30 | 90 | 80 | 17 |
The following table shows the classification of number of vehicles and their speeds on Mumbai-Pune express way. Find the median of the data.
|
Average Speed of
Vehicles (Km/hr) |
60 - 64 | 64 - 69 | 70 - 74 | 75 - 79 | 79 - 84 | 84 - 89 |
| No. of vehicles | 10 | 34 | 55 | 85 | 10 | 6 |
The production of electric bulbs in different factories is shown in the following table. Find the median of the productions.
|
No. of bulbs produced
(Thousands) |
30 - 40 | 40 - 50 | 50 - 60 | 60 - 70 | 70 - 80 | 80 - 90 | 90 - 100 |
| No. of factories | 12 | 35 | 20 | 15 | 8 | 7 | 8 |
Balbharati solutions for Algebra (Mathematics 1) [English] Standard 10 Maharashtra State Board 6 Statistics Practice Set 6.3 [Page 149]
The following table shows the information regarding the milk collected from farmers on a milk collection centre and the content of fat in the milk, measured by a lactometer. Find the mode of fat content.
| Content of fat (%) | 2 - 3 | 3 - 4 | 4 - 5 | 5 - 6 | 6 - 7 |
| Milk collected (Litre) | 30 | 70 | 80 | 60 | 20 |
Electricity used by some families is shown in the following table. Find the mode for use of electricity.
| Use of electricity (Unit) | 0 - 20 | 20 - 40 | 40 - 60 | 60 - 80 | 80 - 100 | 100 - 120 |
| No. of families | 13 | 50 | 70 | 100 | 80 | 17 |
Grouped frequency distribution of supply of milk to hotels and the number of hotels is given in the following table. Find the mode of the supply of milk.
| Milk (Litre) | 1-3 | 3-5 | 5-7 | 7-9 | 9-11 | 11-13 |
| No. of hotels | 7 | 5 | 15 | 20 | 35 | 18 |
The following frequency distribution table gives the ages of 200 patients treated in a hospital in a week. Find the mode of ages of the patients.
| Age (years) | Less than 5 | 5 - 9 | 10 - 14 | 15 - 19 | 20 - 24 | 25 - 29 |
| No. of patients | 38 | 32 | 50 | 36 | 24 | 20 |
Balbharati solutions for Algebra (Mathematics 1) [English] Standard 10 Maharashtra State Board 6 Statistics Practice Set 6.4 [Page 153]
Draw a histogram of the following data.
| Height of student (cm) | 135 - 140 | 140 - 145 | 145 - 150 | 150 - 155 |
| No. of students | 4 | 12 | 16 | 8 |
The table below shows the yield of jowar per acre. Show the data by histogram.
| Yield per acre (quintal) | 2 - 3 | 4 - 5 | 6 - 7 | 8 - 9 | 10 - 11 |
| No. of farmers | 30 | 50 | 55 | 40 | 20 |
In the following table, the investment made by 210 families is shown. Present it in the form of a histogram.
|
Investment
(Thousand Rupees) |
10 - 15 | 15 - 20 | 20 - 25 | 25 - 30 | 30 - 35 |
| No. of families | 30 | 50 | 60 | 55 | 15 |
Time alloted for the preparation of an examination by some students is shown in the table. Draw a histogram to show the information.
| Time (minutes) | 60 - 80 | 80 - 100 | 100 - 120 | 120 - 140 | 140 - 160 |
| No. of students | 14 | 20 | 24 | 22 | 16 |
Balbharati solutions for Algebra (Mathematics 1) [English] Standard 10 Maharashtra State Board 6 Statistics Practice Set 6.5 [Page 157]
Observe the following frequency polygon and write the answers of the questions below it.
- Which class has the maximum number of students?
- Write the classes having zero frequency.
- What is the class-mark of the class, having frequency of 50 students?
- Write the lower and upper class limits of the class whose class mark is 85.
- How many students are in the class 80-90?
| Electricity bill (₹) | 0 - 200 | 200 - 400 | 400 - 600 | 600 - 800 | 800 - 1000 |
| Families | 240 | 300 | 450 | 350 | 160 |
| Result (Percentage) | 30 - 40 | 40 - 50 | 50 - 60 | 60 -70 | 70 - 80 | 80 - 90 | 90 - 100 |
| No. of students | 7 | 33 | 45 | 65 | 47 | 18 | 5 |
Balbharati solutions for Algebra (Mathematics 1) [English] Standard 10 Maharashtra State Board 6 Statistics Practice Set 6.6 [Pages 163 - 164]
The age group and number of persons, who donated blood in a blood donation camp is given below. Draw a pie diagram from it.
|
Age group (Yrs) |
20 - 25 |
25 - 30 |
30 - 35 |
35 - 40 |
|
No. of persons |
80 |
60 |
35 |
25 |
The marks obtained by a student in different subjects are shown. Draw a pie diagram showing the information.
| Subject | English | Marathi | Science | Mathematics | Social science | Hindi |
| Marks | 50 | 70 | 80 | 90 | 60 | 50 |
In a tree plantation programme, the number of trees planted by students of different classes is given in the following table. Draw a pie diagram showing the information.
| Standard | 5th | 6th | 7th | 8th | 9th | 10th |
| No. of trees | 40 | 50 | 75 | 50 | 70 | 75 |
The following table shows the percentages of demands for different fruits registered with a fruit vendor. Show the information by a pie diagram.
| Fruits | Mango | Sweet lime | Apples | Cheeku | Oranges |
| Percentages of demand | 30 | 15 | 25 | 20 | 10 |
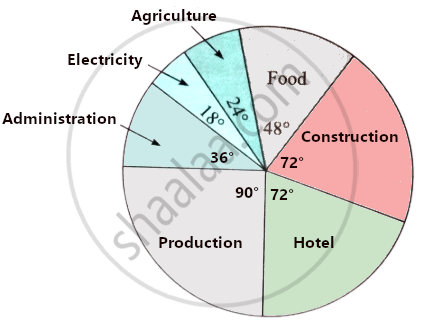
The pie diagram in figure shows the proportions of different workers in a town. Answer the following question with its help.
If the total workers is 10,000; how many of them are in the field of construction ?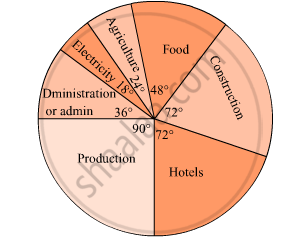
The pie diagram in figure shows the proportions of different workers in a town. Answer the following question with its help.
How many workers are working in the administration ?
The pie diagram in figure shows the proportions of different workers in a town. Answer the following question with its help.
What is the percentage of workers in production?
The annual investments of a family are shown in the adjacent pie diagram. Answer the following questions based on it.
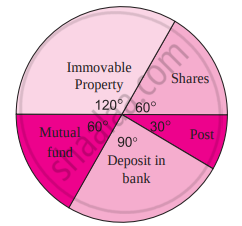
- If the investment in shares is ₹ 2000, find the total investment.
- How much amount is deposited in the bank?
- How much more money is invested in immovable property than in mutual fund?
- How much amount is invested in post?
Balbharati solutions for Algebra (Mathematics 1) [English] Standard 10 Maharashtra State Board 6 Statistics Miscellaneous Problems 6 [Pages 164 - 168]
Find the correct answer from the alternatives given.
The persons of O - blood group are 40%. The classification of persons based on blood groups is to be shown by a pie diagram. What should be the measures of angle for the persons of O - blood group?
114°
140°
104°
144°
Find the correct answer from the alternatives given.
Different expenditures incurred on the construction of a building were shown by a pie diagram. The expenditure Rs 45,000 on cement was shown by a sector of central angle of 75°. What was the total expenditure of the construction ?
2,16,000
3,60,000
4,50,000
7,50,000
Find the correct answer from the alternatives given.
Cumulative frequencies in a grouped frequency table are useful to find ______.
Mean
Median
Mode
All of these
Find the correct answer from the alternatives given.
The formula to find mean from a grouped frequency table is \[X = A + \frac{\sum f_i u_i}{\sum f_i} \times hg\] .
\[\frac{x_i + A}{g}\]
\[\left( x_i - A \right)\]
\[\frac{x_i - A}{g}\]
- \[\frac{A - x_i}{g}\]
Find the correct answer from the alternatives given.
| Distance Covered per litre (km) | 12 - 14 | 14 - 16 | 16 - 18 | 18 - 20 |
| No. of cars | 11 | 12 | 20 | 7 |
The median of the distances covered per litre shown in the above data is in the group . . . . . .
12-14
14 - 16
16 - 18
18-20
Find the correct answer from the alternatives given.
|
No. of trees planted by each student |
1 - 3 | 4 - 6 | 7 - 9 | 10 - 12 |
| No. of students | 7 | 8 | 6 | 4 |
The above data is to be shown by a frequency polygon. The coordinates of the points to show number of students in the class 4-6 are . . . .
(4, 8)
(3, 5)
(5, 8)
(8, 4)
The following table shows the income of farmers in a grape season. Find the mean of their income.
|
Income
(Thousand Rupees)
|
20 - 30 | 30 - 40 | 40 - 50 | 50 - 60 | 60 - 70 | 70 - 80 |
| Farmers | 10 | 11 | 15 | 16 | 18 | 14 |
The loans sanctioned by a bank for construction of farm ponds are shown in the following table. Find the mean of the loans.
|
Loan
(Thousand Rupees)
|
40 - 50 | 50 - 60 | 60 - 70 | 70 - 80 | 80 - 90 |
| No. of farm ponds | 13 | 20 | 24 | 36 | 7 |
The weekly wages of 120 workers in a factory are shown in the following frequency distribution table. Find the mean of the weekly wages.
|
Weekly wages
(Rupees)
|
0 - 2000 | 2000 - 4000 | 4000 - 6000 | 6000 - 8000 |
| No. of workers | 15 | 35 | 50 | 20 |
The following frequency distribution table shows the amount of aid given to 50 flood affected families. Find the mean of the amount of aid.
|
Amount of aid
(Thousand rupees)
|
50 - 60 | 60 - 70 | 70 - 80 | 80 - 90 | 90 - 100 |
| No. of families | 7 | 13 | 20 | 6 | 4 |
The distances covered by 250 public transport buses in a day is shown in the following frequency distribution table. Find the median of the distance.
|
Distance (km)
|
200 - 210 | 210 - 220 | 220 - 230 | 230 - 240 | 240 - 250 |
| No. of buses | 40 | 60 | 80 | 50 | 20 |
The prices of different articles and demand for them is shown in the following frequency distribution table. Find the median of the prices.
|
Price (Rupees)
|
20 less than | 20 - 40 | 40 - 60 | 60 - 80 | 80 - 100 |
| No. of articles | 140 | 100 | 80 | 60 | 20 |
The following frequency table shows the demand for a sweet and the number of customers. Find the mode of demand of sweet.
|
Weight of sweet (gram)
|
0 - 250 | 250 - 500 | 500 - 750 | 750 - 1000 | 1000 - 1250 |
| No. of customers | 10 | 60 | 25 | 20 | 15 |
Draw a histogram for the following frequency distribution.
|
Use of electricity (Unit)
|
50 - 70 | 70 - 90 | 90 - 110 | 110 - 130 | 130 - 150 | 150 - 170 |
| No. of families | 150 | 400 | 460 | 540 | 600 | 350 |
In a handloom factory different workers take different periods of time to weave a saree. The number of workers and their required periods are given below. Present the information by a frequency polygon.
|
No. of days
|
8 - 10 | 10 - 12 | 12 - 14 | 14 - 16 | 16 - 18 | 18 - 20 |
| No. of workers | 5 | 16 | 30 | 40 | 35 | 14 |
The time required for students to do a science experiment and the number of students is shown in the following grouped frequency distribution table. Show the information by a histogram and also by a frequency polygon.
|
Time required for
experiment (minutes) |
20 - 22 | 22 - 24 | 24 - 26 | 26 - 28 | 28 - 30 | 30 - 32 |
| No. of students | 8 | 16 | 22 | 18 | 14 | 12 |
Draw a frequency polygon for the following grouped frequency distribution table.
|
Age of the donor
(Yrs.) |
20 - 24 | 25 - 29 | 30 - 34 | 35 - 39 | 40 - 44 | 45 - 49 |
| No. of blood doners | 38 | 46 | 35 | 24 | 15 | 12 |
The following table shows the average rainfall in 150 towns. Show the information by a frequency polygon.
|
Average rainfall (cm)
|
0 - 20 | 20 - 40 | 40 - 60 | 60 - 80 | 80 - 100 |
| No. of towns | 14 | 12 | 36 | 48 | 40 |
Observe the adjacent pie diagram. It shows the percentages of number of vehicles passing a signal in a town between 8 am and 10 am
(1) Find the central angle for each type of vehicle.
(2) If the number of two-wheelers is 1200, find the number of all vehicles.

The following table shows causes of noise pollution. Show it by a pie diagram.
|
Construction
|
Traffic | Aircraft take offs | Industry | Trains |
| 10% | 50% | 9% | 20% | 11% |
A survey of students was made to know which game they like. The data obtained in the survey is presented in the adjacent pie diagram. If the total number of students are 1000,
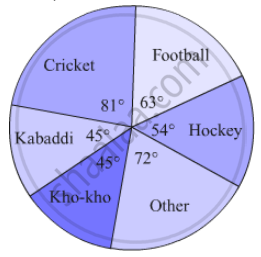
(1) How many students like cricket ?
(2) How many students like football ?
(3) How many students prefer other games ?
Medical check up of 180 women was conducted in a health centre in a village. 50 of them were short of haemoglobin, 10 suffered from cataract and 25 had respiratory disorders. The remaining women were healthy. Show the information by a pie diagram.
On an environment day, students in a school planted 120 trees under plantation project. The information regarding the project is shown in the following table. Show it by a pie diagram.
|
Tree name
|
Karanj | Behada | Arjun | Bakul | Kadunimb |
| No. of trees | 20 | 28 | 24 | 22 | 26 |
Solutions for 6: Statistics
Balbharati solutions for Algebra (Mathematics 1) [English] Standard 10 Maharashtra State Board chapter 6 - Statistics
Shaalaa.com has the Maharashtra State Board Mathematics Algebra (Mathematics 1) [English] Standard 10 Maharashtra State Board Maharashtra State Board solutions in a manner that help students grasp basic concepts better and faster. The detailed, step-by-step solutions will help you understand the concepts better and clarify any confusion. Balbharati solutions for Mathematics Algebra (Mathematics 1) [English] Standard 10 Maharashtra State Board Maharashtra State Board 6 (Statistics) include all questions with answers and detailed explanations. This will clear students' doubts about questions and improve their application skills while preparing for board exams.
Further, we at Shaalaa.com provide such solutions so students can prepare for written exams. Balbharati textbook solutions can be a core help for self-study and provide excellent self-help guidance for students.
Concepts covered in Algebra (Mathematics 1) [English] Standard 10 Maharashtra State Board chapter 6 Statistics are Histograms, Frequency Polygon, Concepts of Statistics, Mean of Grouped Data, Median of Grouped Data, Mode of Grouped Data, Pictorial Representation of Statistical Data, Pie Diagram, Measures of Central Tendency for Different Data Types.
Using Balbharati Algebra (Mathematics 1) [English] Standard 10 Maharashtra State Board solutions Statistics exercise by students is an easy way to prepare for the exams, as they involve solutions arranged chapter-wise and also page-wise. The questions involved in Balbharati Solutions are essential questions that can be asked in the final exam. Maximum Maharashtra State Board Algebra (Mathematics 1) [English] Standard 10 Maharashtra State Board students prefer Balbharati Textbook Solutions to score more in exams.
Get the free view of Chapter 6, Statistics Algebra (Mathematics 1) [English] Standard 10 Maharashtra State Board additional questions for Mathematics Algebra (Mathematics 1) [English] Standard 10 Maharashtra State Board Maharashtra State Board, and you can use Shaalaa.com to keep it handy for your exam preparation.
