Advertisements
Advertisements
Question
The prices of different articles and demand for them is shown in the following frequency distribution table. Find the median of the prices.
|
Price (Rupees)
|
20 less than | 20 – 40 | 40 – 60 | 60 – 80 | 80 – 100 |
| No. of articles | 140 | 100 | 80 | 60 | 20 |
Solution
|
Class
(Prices in Rupees) |
Frequency (Number of articles) (fi) |
Cumulaive frequency less than the upper limit |
| 20 less than | 140 | 140 → cf |
| 20 – 40 | 100 → f | 240 |
| 40 – 60 | 80 | 320 |
| 60 – 80 | 60 | 380 |
| 80 – 100 | 20 | 400 |
| N = 400 |
From the above table, we get
∑fi = N = 400
∴ `N/2 = 400/2 = 200`
∴ The cumulative frequency greater than (or equal to) 200 is 240.
∴ 20 – 40 is the median class.
Now, L = 20, f = 100, cf = 140, h = 20
Now, Median = `L + [(N/2 - cf)/f] xx h`
`= 20+ ((400/2-140)/100) xx20`
`= 20 + ((200 - 140)/100) xx 20`
= `20 + (60/100) xx 20`
= 20 + 12
= Rs. 32
Hence, the median of the prices is Rs. 32.
RELATED QUESTIONS
For a certain frequency distribution, the value of Mean is 101 and Median is 100. Find the value of Mode.
Find the following table gives the distribution of the life time of 400 neon lamps:
| Life time (in hours) | Number of lamps |
| 1500 – 2000 | 14 |
| 2000 – 2500 | 56 |
| 2500 – 3000 | 60 |
| 3000 – 3500 | 86 |
| 3500 – 4000 | 74 |
| 4000 – 4500 | 62 |
| 4500 – 5000 | 48 |
Find the median life time of a lamp.
A life insurance agent found the following data for distribution of ages of 100 policy holders. Calculate the median age, if policies are given only to persons having age 18 years onwards but less than 60 years.
| Age (in years) | Number of policy holders |
| Below 20 | 2 |
| 20 - 25 | 4 |
| 25 - 30 | 18 |
| 30 - 35 | 21 |
| 35 - 40 | 33 |
| 40 - 45 | 11 |
| 45 - 50 | 3 |
| 50 - 55 | 6 |
| 55 - 60 | 2 |
The median of the following observations
11, 12, 14, (x - 2), (x + 4), (x + 9), 32, 38, 47 arranged in ascending order is 24.
Find the value of x and hence find the mean.
Following are the lives in hours of 15 pieces of the components of aircraft engine. Find the median:
715, 724, 725, 710, 729, 745, 694, 699, 696, 712, 734, 728, 716, 705, 719.
From the following data, find:
Upper quartile
25, 10, 40, 88, 45, 60, 77, 36, 18, 95, 56, 65, 7, 0, 38 and 83
Calculate the median from the following frequency distribution table:
| Class | 5 – 10 | 10 – 15 | 15 – 20 | 20 – 25 | 25 – 30 | 30 – 35 | 35 – 40 | 40 – 45 |
| Frequency | 5 | 6 | 15 | 10 | 5 | 4 | 2 | 2 |
Calculate the missing frequency from the following distribution, it being given that the median of distribution is 24.
| Class | 0 – 10 | 10 – 20 | 20 – 30 | 30 – 40 | 40 - 50 |
| Frequency | 5 | 25 | ? | 18 | 7 |
The median of the following data is 16. Find the missing frequencies a and b if the total of frequencies is 70.
| Class | 0 – 5 | 5 – 10 | 10 – 15 | 15 – 20 | 20 – 25 | 25 – 30 | 30 – 35 | 35 – 40 |
| Frequency | 12 | a | 12 | 15 | b | 6 | 6 | 4 |
In the following data the median of the runs scored by 60 top batsmen of the world in one-day international cricket matches is 5000. Find the missing frequencies x and y.
| Runs scored | 2500 – 3500 | 3500 – 4500 | 4500 – 5500 | 5500 – 6500 | 6500 – 7500 | 7500 - 8500 |
| Number of batsman | 5 | x | y | 12 | 6 | 2 |
Calculate the median for the following data:
| Class | 19 – 25 | 26 – 32 | 33 – 39 | 40 – 46 | 47 – 53 | 54 - 60 |
| Frequency | 35 | 96 | 68 | 102 | 35 | 4 |
Find the median from the following data:
| Marks | No of students |
| Below 10 | 12 |
| Below 20 | 32 |
| Below 30 | 57 |
| Below 40 | 80 |
| Below 50 | 92 |
| Below 60 | 116 |
| Below 70 | 164 |
| Below 80 | 200 |
Find the correct answer from the alternatives given.
| Distance Covered per litre (km) | 12 - 14 | 14 - 16 | 16 - 18 | 18 - 20 |
| No. of cars | 11 | 12 | 20 | 7 |
The median of the distances covered per litre shown in the above data is in the group . . . . . .
The annual rainfall record of a city for 66 days is given in the following table :
| Rainfall (in cm ): | 0-10 | 10-20 | 20-30 | 30-40 | 40-50 | 50-60 |
| Number of days : | 22 | 10 | 8 | 15 | 5 | 6 |
Calculate the median rainfall using ogives of more than type and less than type.
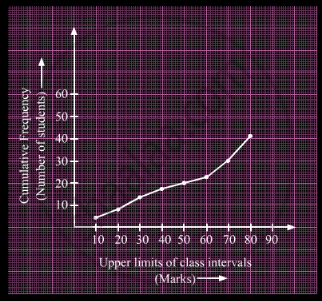
A student draws a cumulative frequency curve for the marks obtained by 40 students of a class as shown below. Find the median marks obtained by the students of the class.
Below is the given frequency distribution of words in an essay:
| Number of words | Number of Candidates |
| 600 - 800 | 12 |
| 800 - 1000 | 14 |
| 1000 - 1200 | 40 |
| 1200 - 1400 | 15 |
| 1400 - 1600 | 19 |
Find the mean number of words written.
Find the Median of the following distribution:
| x | 3 | 5 | 10 | 12 | 8 | 15 |
| f | 2 | 4 | 6 | 10 | 8 | 7 |
Calculate the median of the following distribution:
| Weight (in nearest kg.) | No. of students |
| 46 | 7 |
| 48 | 5 |
| 50 | 8 |
| 52 | 12 |
| 53 | 10 |
| 54 | 2 |
| 55 | 1 |
Read the following passage and answer the questions given below.
|
Electric buses are becoming popular nowadays. These buses have the electricity stored in a battery. Electric buses have a range of approximately 280 km with just charge. These buses are superior to diesel buses as they reduce brake wear and also reduce pollution. 'transport department of a city wants to buy some electric buses for the city. So, the department wants to know the distance travelled by existing public transport buses in a day. The following data shows the distance travelled by 50 existing public transport buses in a day.
|
| Daily distance travelled (in km) | 100 – 120 | 120 – 140 | 140 – 160 | 160 – 180 | 180 – 200 |
| Number of buses | 12 | 14 | 8 | 6 | 10 |
- Find the 'median' distance travelled by a bus.
- Find the 'mean (average)' distance travelled by a bus.
A life insurance agent found the following data for distribution of ages of 100 policy holders. Calculate the median age, if policies are given only to persons having age 18 years onwards but less than 60 year.
| Age (in years) | Number of policy holders |
| Below 20 | 2 |
| Below 25 | 6 |
| Below 30 | 24 |
| Below 35 | 45 |
| Below 40 | 78 |
| Below 45 | 89 |
| Below 50 | 92 |
| Below 55 | 98 |
| Below 60 | 100 |
