Advertisements
Advertisements
Question
For a certain frequency distribution, the value of Mean is 101 and Median is 100. Find the value of Mode.
Solution
The interrelation between the measures of central tendency is given by
Mean – Mode = 3(Mean - Median)
Given that Mean = 101 and Median = 100
Thus from the above relation, we have,
101 – Mode = 3 (101 - 100)
101 - Mode = 3
101 - 3 = Mode
Mode = 98
APPEARS IN
RELATED QUESTIONS
The mean of following numbers is 68. Find the value of ‘x’. 45, 52, 60, x, 69, 70, 26, 81 and 94. Hence, estimate the median.
The following table gives the frequency distribution of married women by age at marriage:
| Age (in years) | Frequency |
| 15-19 | 53 |
| 20-24 | 140 |
| 25-29 | 98 |
| 30-34 | 32 |
| 35-39 | 12 |
| 40-44 | 9 |
| 45-49 | 5 |
| 50-54 | 3 |
| 55-59 | 3 |
| 60 and above | 2 |
Calculate the median and interpret the results.
Compute the median for the following data:
| Marks | No. of students |
| More than 150 | 0 |
| More than 140 | 12 |
| More than 130 | 27 |
| More than 120 | 60 |
| More than 110 | 105 |
| More than 100 | 124 |
| More than 90 | 141 |
| More than 80 | 150 |
The marks obtained by 19 students of a class are given below:
27, 36, 22, 31, 25, 26, 33, 24, 37, 32, 29, 28, 36, 35, 27, 26, 32, 35 and 28.
Find:
- Median
- Lower quartile
- Upper quartile
- Inter-quartile range
In the following data the median of the runs scored by 60 top batsmen of the world in one-day international cricket matches is 5000. Find the missing frequencies x and y.
| Runs scored | 2500 – 3500 | 3500 – 4500 | 4500 – 5500 | 5500 – 6500 | 6500 – 7500 | 7500 - 8500 |
| Number of batsman | 5 | x | y | 12 | 6 | 2 |
Find the median wages for the following frequency distribution:
| Wages per day (in Rs) | 61 – 70 | 71 – 80 | 81 – 90 | 91 – 100 | 101 – 110 | 111 – 120 |
| No. of women workers | 5 | 15 | 20 | 30 | 20 | 8 |
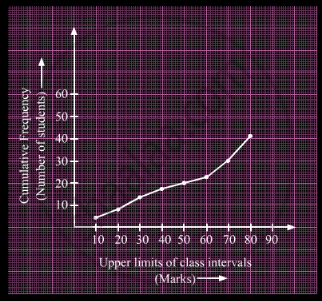
A student draws a cumulative frequency curve for the marks obtained by 40 students of a class as shown below. Find the median marks obtained by the students of the class.

If the difference of Mode and Median of a data is 24, then the difference of median and mean is ______.
If the mean of the following distribution is 3, find the value of p.
| x | 1 | 2 | 3 | 5 | p + 4 |
| f | 9 | 6 | 9 | 3 | 6 |
In the following table, Σf = 200 and mean = 73. Find the missing frequencies f1, and f2.
| x | 0 | 50 | 100 | 150 | 200 | 250 |
| f | 46 | f1 | f2 | 25 | 10 | 5 |
Find the median of:
66, 98, 54, 92, 87, 63, 72.
Find the Median of the following distribution:
| x | 3 | 5 | 10 | 12 | 8 | 15 |
| f | 2 | 4 | 6 | 10 | 8 | 7 |
Find the median of the following frequency distribution:
| x | 10 | 11 | 12 | 13 | 14 | 15 |
| f | 1 | 4 | 7 | 5 | 9 | 3 |
Mode and mean of a data are 12k and 15A. Median of the data is ______.
If 35 is removed from the data, 30, 34, 35, 36, 37, 38, 39, 40 then the median increases by ______.
The Median when it is given that mode and mean are 8 and 9 respectively, is ______.
Consider the following frequency distribution:
| Class | 0 – 5 | 6 – 11 | 12 – 17 | 18 – 23 | 24 – 29 |
| Frequency | 13 | 10 | 15 | 8 | 11 |
The upper limit of the median class is:
The median of an ungrouped data and the median calculated when the same data is grouped are always the same. Do you think that this is a correct statement? Give reason.
Will the median class and modal class of grouped data always be different? Justify your answer.
