Advertisements
Advertisements
Question
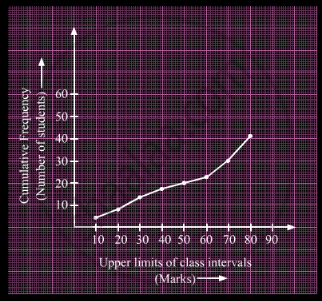
A student draws a cumulative frequency curve for the marks obtained by 40 students of a class as shown below. Find the median marks obtained by the students of the class.

Solution
Here, N = 40
So, `(N/2) = 20`
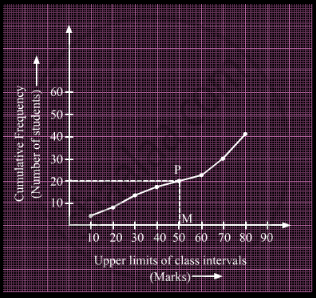
Draw a line parallel to x-axis from the point (0, 20), intersecting the graph at point P.

Now, draw PM from P on the x-axis. The x-coordinate of M gives us the median.
∴ Median = 50
APPEARS IN
RELATED QUESTIONS
A life insurance agent found the following data for distribution of ages of 100 policy holders. Calculate the median age, if policies are given only to persons having age 18 years onwards but less than 60 years.
| Age (in years) | Number of policy holders |
| Below 20 | 2 |
| 20 - 25 | 4 |
| 25 - 30 | 18 |
| 30 - 35 | 21 |
| 35 - 40 | 33 |
| 40 - 45 | 11 |
| 45 - 50 | 3 |
| 50 - 55 | 6 |
| 55 - 60 | 2 |
An incomplete distribution is given below:
| Variable: | 10-20 | 20-30 | 30-40 | 40-50 | 50-60 | 60-70 | 70-80 |
| Frequency: | 12 | 30 | - | 65 | - | 25 | 18 |
You are given that the median value is 46 and the total number of items is 230.
(i) Using the median formula fill up missing frequencies.
(ii) Calculate the AM of the completed distribution.
The weights (in kg) of 10 students of a class are given below:
21, 28.5, 20.5, 24, 25.5, 22, 27.5, 28, 21 and 24.
Find the median of their weights.
The weight of 60 boys are given in the following distribution table:
| Weight (kg) | 37 | 38 | 39 | 40 | 41 |
| No. of boys | 10 | 14 | 18 | 12 | 6 |
Find:
- Median
- Lower quartile
- Upper quartile
- Inter-quartile range
In a hospital, the ages of diabetic patients were recorded as follows. Find the median age.
| Age (in years) |
0 – 15 | 15 – 30 | 30 – 45 | 45 – 60 | 60 - 75 |
| No. of patients | 5 | 20 | 40 | 50 | 25 |
Find the median wages for the following frequency distribution:
| Wages per day (in Rs) | 61 – 70 | 71 – 80 | 81 – 90 | 91 – 100 | 101 – 110 | 111 – 120 |
| No. of women workers | 5 | 15 | 20 | 30 | 20 | 8 |
The annual rainfall record of a city for 66 days is given in the following table :
| Rainfall (in cm ): | 0-10 | 10-20 | 20-30 | 30-40 | 40-50 | 50-60 |
| Number of days : | 22 | 10 | 8 | 15 | 5 | 6 |
Calculate the median rainfall using ogives of more than type and less than type.
The median of first 10 prime numbers is
Weekly income of 600 families is tabulated below:
| Weekly income (in Rs) |
Number of families |
| 0 – 1000 | 250 |
| 1000 – 2000 | 190 |
| 2000 – 3000 | 100 |
| 3000 – 4000 | 40 |
| 4000 – 5000 | 15 |
| 5000 – 6000 | 5 |
| Total | 600 |
Compute the median income.
A survey conducted on 20 households in a locality by a group of students resulted in the following frequency table for the number of family members in a household:
| Family size | 1 – 3 | 3 – 5 | 5 – 7 | 7 – 9 | 9 – 11 |
| Numbers of Families | 7 | 8 | 2 | 2 | 1 |
Find the median of this data.
