Advertisements
Advertisements
प्रश्न
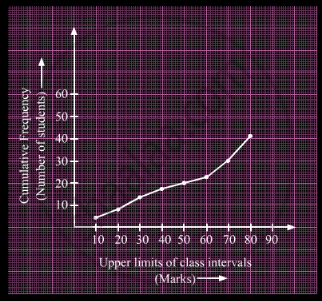
A student draws a cumulative frequency curve for the marks obtained by 40 students of a class as shown below. Find the median marks obtained by the students of the class.

उत्तर
Here, N = 40
So, `(N/2) = 20`
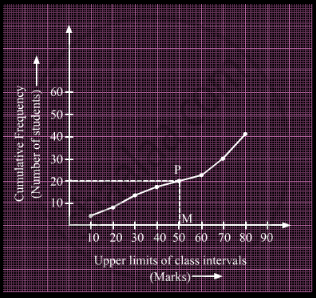
Draw a line parallel to x-axis from the point (0, 20), intersecting the graph at point P.

Now, draw PM from P on the x-axis. The x-coordinate of M gives us the median.
∴ Median = 50
APPEARS IN
संबंधित प्रश्न
Find the missing frequencies and the median for the following distribution if the mean is 1.46.
| No. of accidents: | 0 | 1 | 2 | 3 | 4 | 5 | Total |
| Frequency (No. of days): | 46 | ? | ? | 25 | 10 | 5 | 200 |
Compute the median for the following data:
| Marks | No. of students |
| More than 150 | 0 |
| More than 140 | 12 |
| More than 130 | 27 |
| More than 120 | 60 |
| More than 110 | 105 |
| More than 100 | 124 |
| More than 90 | 141 |
| More than 80 | 150 |
From the following data, find:
Median
25, 10, 40, 88, 45, 60, 77, 36, 18, 95, 56, 65, 7, 0, 38 and 83
Find the median wages for the following frequency distribution:
| Wages per day (in Rs) | 61 – 70 | 71 – 80 | 81 – 90 | 91 – 100 | 101 – 110 | 111 – 120 |
| No. of women workers | 5 | 15 | 20 | 30 | 20 | 8 |
The following frequency distribution table shows the number of mango trees in a grove and their yield of mangoes, and also the cumulative frequencies. Find the median of the data.
| Class (No. of mangoes) |
Frequency (No. of trees) |
Cumulative frequency (less than) |
| 50-100 | 33 | 33 |
| 100-150 | 30 | 63 |
| 150-200 | 90 | 153 |
| 200-250 | 80 | 233 |
| 250-300 | 17 | 250 |
If 35 is removed from the data, 30, 34, 35, 36, 37, 38, 39, 40 then the median increases by ______.
Following is the distribution of the long jump competition in which 250 students participated. Find the median distance jumped by the students. Interpret the median
| Distance (in m) |
0 – 1 | 1 – 2 | 2 – 3 | 3 – 4 | 4 – 5 |
| Number of Students |
40 | 80 | 62 | 38 | 30 |
If in a frequency distribution, the mean and median are 21 and 22 respectively, then its mode is approximately ______.
The median of 100 observations grouped in classes of equal width is 25. If the median class interval is 20 –30 and the number of observations less than 20 is 45, then the frequency of median class is ______.
Consider the following frequency distribution:
| Class | 0 – 6 | 6 – 12 | 12 – 18 | 18 – 24 | 24 – 30 |
| Frequency | 12 | 10 | 15 | 8 | 11 |
The median class is:
