Advertisements
Advertisements
प्रश्न
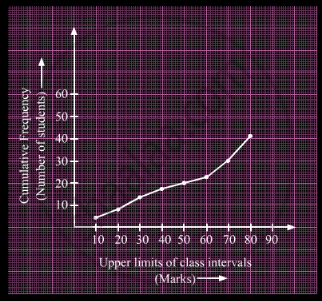
A student draws a cumulative frequency curve for the marks obtained by 40 students of a class as shown below. Find the median marks obtained by the students of the class.

उत्तर
Here, N = 40
So, `(N/2) = 20`
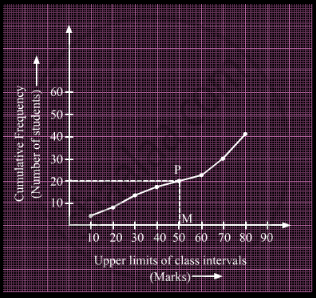
Draw a line parallel to x-axis from the point (0, 20), intersecting the graph at point P.

Now, draw PM from P on the x-axis. The x-coordinate of M gives us the median.
∴ Median = 50
APPEARS IN
संबंधित प्रश्न
The ages of 37 students in a class are given in the following table:
| Age (in years) | 11 | 12 | 13 | 14 | 15 | 16 |
| Frequency | 2 | 4 | 6 | 10 | 8 | 7 |
Given below is the number of units of electricity consumed in a week in a certain locality:
| Class | 65 – 85 | 85 – 105 | 105 – 125 | 125 – 145 | 145 – 165 | 165 – 185 | 185 – 200 |
| Frequency | 4 | 5 | 13 | 20 | 14 | 7 | 4 |
Calculate the median.
Find the median wages for the following frequency distribution:
| Wages per day (in Rs) | 61 – 70 | 71 – 80 | 81 – 90 | 91 – 100 | 101 – 110 | 111 – 120 |
| No. of women workers | 5 | 15 | 20 | 30 | 20 | 8 |
The annual rainfall record of a city for 66 days is given in the following table :
| Rainfall (in cm ): | 0-10 | 10-20 | 20-30 | 30-40 | 40-50 | 50-60 |
| Number of days : | 22 | 10 | 8 | 15 | 5 | 6 |
Calculate the median rainfall using ogives of more than type and less than type.
In the graphical representation of a frequency distribution, if the distance between mode and mean is ktimes the distance between median and mean, then write the value of k.
If the median of the data: 24, 25, 26, x + 2, x + 3, 30, 31, 34 is 27.5, then x =
If 35 is removed from the data: 30, 34, 35, 36, 37, 38, 39, 40, then the median increased by
Find the median of:
66, 98, 54, 92, 87, 63, 72.
Below is the given frequency distribution of words in an essay:
| Number of words | Number of Candidates |
| 600 - 800 | 12 |
| 800 - 1000 | 14 |
| 1000 - 1200 | 40 |
| 1200 - 1400 | 15 |
| 1400 - 1600 | 19 |
Find the mean number of words written.
Weekly income of 600 families is tabulated below:
| Weekly income (in Rs) |
Number of families |
| 0 – 1000 | 250 |
| 1000 – 2000 | 190 |
| 2000 – 3000 | 100 |
| 3000 – 4000 | 40 |
| 4000 – 5000 | 15 |
| 5000 – 6000 | 5 |
| Total | 600 |
Compute the median income.
