Advertisements
Advertisements
प्रश्न
Given below is the number of units of electricity consumed in a week in a certain locality:
| Class | 65 – 85 | 85 – 105 | 105 – 125 | 125 – 145 | 145 – 165 | 165 – 185 | 185 – 200 |
| Frequency | 4 | 5 | 13 | 20 | 14 | 7 | 4 |
Calculate the median.
उत्तर
| Class | Frequency (f) | Cumulative Frequency (cf) |
| 65- 85 | 4 | 4 |
| 85 – 105 | 5 | 9 |
| 105 – 125 | 13 | 22 |
| 125 – 145 | 20 | 42 |
| 145 – 165 | 14 | 56 |
| 165 – 185 | 7 | 63 |
| 185 – 205 | 4 | 67 |
| N = Σ𝑓 = 67 |
Now, N = 67
`⇒ N/2` = 33.5.
The cumulative frequency just greater than 33.5 is 42 and the corresponding class is 125 - 145.
Thus, the median class is 125 – 145.
∴ l = 125, h = 20, f = 20, cf = c.f. of preceding class = 22 and `N/2` = 33.5.
Now,
Median, `M = l + {h×((N/2−cf)/f)}`
`= 125 + {20 × ((33.5 − 22)/20)}`
= 125 + 11.5
= 136.5
Hence, the median = 136.5.
APPEARS IN
संबंधित प्रश्न
Find the following table gives the distribution of the life time of 400 neon lamps:
| Life time (in hours) | Number of lamps |
| 1500 – 2000 | 14 |
| 2000 – 2500 | 56 |
| 2500 – 3000 | 60 |
| 3000 – 3500 | 86 |
| 3500 – 4000 | 74 |
| 4000 – 4500 | 62 |
| 4500 – 5000 | 48 |
Find the median life time of a lamp.
Calculate the median from the following data:
| Rent (in Rs.): | 15 - 25 | 25 - 35 | 35 - 45 | 45 - 55 | 55 - 65 | 65 - 75 | 75 - 85 | 85 - 95 |
| No. of Houses: | 8 | 10 | 15 | 25 | 40 | 20 | 15 | 7 |
Estimate the median for the given data by drawing an ogive:
| Class | 0 – 10 | 10 – 20 | 20 – 30 | 30 – 40 | 40 – 50 |
| Frequency | 4 | 9 | 15 | 14 | 8 |
The median of the following data is 50. Find the values of p and q, if the sum of all the frequencies is 90.
| Marks: | 20 -30 | 30-40 | 40-50 | 50-60 | 60-70 | 70-80 | 80-90 |
| Frequency: | P | 15 | 25 | 20 | q | 8 | 10 |
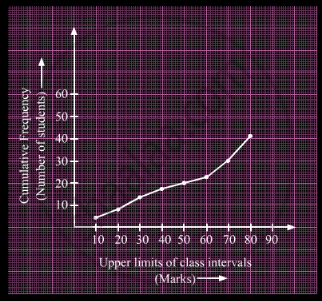
A student draws a cumulative frequency curve for the marks obtained by 40 students of a class as shown below. Find the median marks obtained by the students of the class.

Write the median class of the following distribution:
| Class-interval: | 0−10 | 10−20 | 20−30 | 30−40 | 40−50 | 50−60 | 60−70 |
| Frequency: | 4 | 4 | 8 | 10 | 12 | 8 | 4 |
The arithmetic mean and mode of a data are 24 and 12 respectively, then its median is
The median of an ungrouped data and the median calculated when the same data is grouped are always the same. Do you think that this is a correct statement? Give reason.
Will the median class and modal class of grouped data always be different? Justify your answer.
The following table shows classification of number of workers and number of hours they work in software company. Prepare less than upper limit type cumulative frequency distribution table:
| Number of hours daily | Number of workers |
| 8 - 10 | 150 |
| 10 - 12 | 500 |
| 12 - 14 | 300 |
| 14 - 16 | 50 |
