Advertisements
Advertisements
प्रश्न
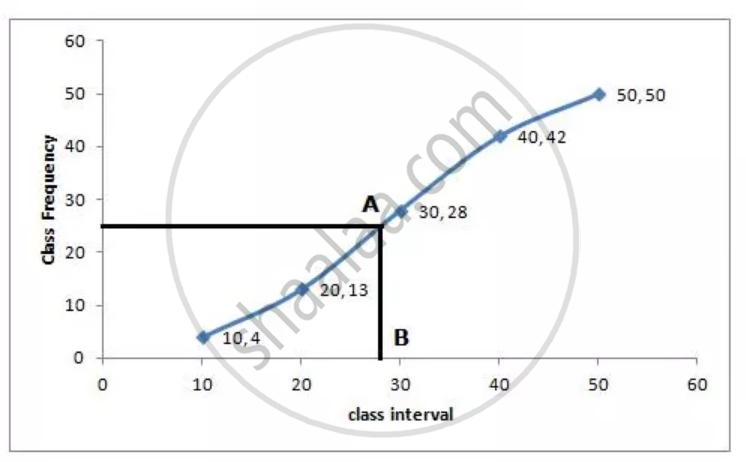
Estimate the median for the given data by drawing an ogive:
| Class | 0 – 10 | 10 – 20 | 20 – 30 | 30 – 40 | 40 – 50 |
| Frequency | 4 | 9 | 15 | 14 | 8 |
उत्तर
| Class | Frequency | Cumulative Frequency |
| 0 – 10 | 4 | 4 |
| 10 – 20 | 9 | 13 |
| 20 – 30 | 15 | 28 |
| 30 – 40 | 14 | 42 |
| 40 – 50 | 8 | 50 |
Number of terms = 50
∴ Median = `(25 + 26^(th))/2` term
= 25.5th term

Through mark of 25.5 on the y-axis, draw a line parallel to x-axis which meets the curve at A. From A, draw a perpendicular to x-axis, which meets x-axis at B.
The value of B is the median which is 28
APPEARS IN
संबंधित प्रश्न
Below is the given frequency distribution of words in an essay
| Number of Words | Number of Candidates |
| 600 – 800 | 8 |
| 800 – 1000 | 22 |
| 1000 – 1200 | 40 |
| 1200 – 1400 | 18 |
| 1400 - 1600 | 12 |
Find the mean number of words written.
The following table shows ages of 3000 patients getting medical treatment in a hospital on a particular day :
| Age (in years) | No. of Patients |
| 10-20 | 60 |
| 20-30 | 42 |
| 30-40 | 55 |
| 40-50 | 70 |
| 50-60 | 53 |
| 60-70 | 20 |
Find the median age of the patients.
Following is the distribution of I.Q. of loo students. Find the median I.Q.
| I.Q.: | 55 - 64 | 65 - 74 | 75 - 84 | 85 - 94 | 95 - 104 | 105 - 114 | 115 - 124 | 125 - 134 | 135 - 144 |
| No of Students: | 1 | 2 | 9 | 22 | 33 | 22 | 8 | 2 | 1 |
The weights (in kg) of 10 students of a class are given below:
21, 28.5, 20.5, 24, 25.5, 22, 27.5, 28, 21 and 24.
Find the median of their weights.
In a hospital, the ages of diabetic patients were recorded as follows. Find the median age.
| Age (in years) |
0 – 15 | 15 – 30 | 30 – 45 | 45 – 60 | 60 - 75 |
| No. of patients | 5 | 20 | 40 | 50 | 25 |
If the median of the following frequency distribution is 32.5, find the values of `f_1 and f_2`.
| Class | 0 – 10 | 10 – 20 | 20 – 30 | 30 -40 | 40 – 50 | 50 – 60 | 60 – 70 | Total |
| Frequency | `f_1` |
5 |
9 | 12 | `f_2` | 3 | 2 | 40 |
If the mean of the following distribution is 3, find the value of p.
| x | 1 | 2 | 3 | 5 | p + 4 |
| f | 9 | 6 | 9 | 3 | 6 |
If 35 is removed from the data, 30, 34, 35, 36, 37, 38, 39, 40 then the median increases by ______.
The median of the following frequency distribution is 35. Find the value of x.
| Class: | 0 – 10 | 10 – 20 | 20 – 30 | 30 – 40 | 40 – 50 |
| Frequency: | 6 | 3 | x | 12 | 19 |
The following table gives the monthly consumption of electricity of 100 families:
| Monthly Consumption (in units) |
130 – 140 | 140 – 150 | 150 – 160 | 160 – 170 | 170 – 180 | 180 – 190 | 190 – 200 |
| Number of families |
5 | 9 | 17 | 28 | 24 | 10 | 7 |
Find the median of the above data.
