Advertisements
Advertisements
प्रश्न
If the median of the following frequency distribution is 32.5, find the values of `f_1 and f_2`.
| Class | 0 – 10 | 10 – 20 | 20 – 30 | 30 -40 | 40 – 50 | 50 – 60 | 60 – 70 | Total |
| Frequency | `f_1` |
5 |
9 | 12 | `f_2` | 3 | 2 | 40 |
उत्तर
| Class | Frequency (f) | Cumulative Frequency (cf) |
| 0 – 10 | `f_1` | `f_1` |
| 10 – 20 | 5 | `f_1`+5 |
| 20 – 30 | 9 | `f_1`+14 |
| 30 – 40 | 12 | `f_1`+26 |
| 40 – 50 | `f_2` | `f_1`+`f_2`+26 |
| 50 – 60 | 3 | `f_1`+`f_2`+29 |
| 60 – 70 | 2 | `f_1`+`f_2`+31 |
| N = Σ𝑓 = 40 |
Now,` f_1 + f_2 + 31 = 40`
⇒` f_1 + f_2 = 9`
⇒ `f_2 = 9 - f_1`
The median is 32.5 which lies in 30 – 40.
Hence, median class = 30 – 40
Here, `l = 30, N/2 = 40/2 = 20, f = 12 and cf = 14 + f_1`
Now, median = 32.5
`⇒ l + ((N/2−Cf)/f) × h = 32.5`
`⇒ 30 + ((20 −(14 + f1))/ 12)× 10 = 32.5`
`⇒ (6 − f_1)/ 12` × 10 = 2.5
`⇒ (60 − 10f_1)/12 = 2.5`
`⇒ 60 – 10f_1 = 30`
`⇒ 10f_1 = 30`
`⇒ f_1 = 3`
From equation (i), we have:
`f_2 = 9 – 3`
`⇒ f_2 = 6`
संबंधित प्रश्न
The marks obtained by 30 students in a class assignment of 5 marks are given below.
| Marks | 0 | 1 | 2 | 3 | 4 | 5 |
| No. of Students |
1 | 3 | 6 | 10 | 5 | 5 |
Calculate the mean, median and mode of the above distribution
Calculate the median from the following data:
| Marks below: | 10 | 20 | 30 | 40 | 50 | 60 | 70 | 80 |
| No. of students: | 15 | 35 | 60 | 84 | 96 | 127 | 198 | 250 |
Estimate the median for the given data by drawing an ogive:
| Class | 0 – 10 | 10 – 20 | 20 – 30 | 30 – 40 | 40 – 50 |
| Frequency | 4 | 9 | 15 | 14 | 8 |
Find the median from the following data:
| Class | 1 – 5 | 6 – 10 | 11 – 15 | 16 – 20 | 21 – 25 | 26 – 30 | 31 – 35 | 35 – 40 | 40 – 45 |
| Frequency | 7 | 10 | 16 | 32 | 24 | 16 | 11 | 5 | 2 |
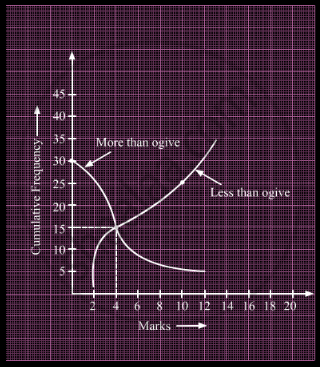
What is the value of the median of the data using the graph in the following figure of less than ogive and more than ogive?

Which measure of central tendency can be determine graphically?
Find the median of the following frequency distribution:
| x | 10 | 11 | 12 | 13 | 14 | 15 |
| f | 1 | 4 | 7 | 5 | 9 | 3 |
The maximum speeds, in km per hour, of 35 cars in a race are given as follows:
| Speed (km/h) | 85 – 100 | 100 – 115 | 115 – 130 | 130 – 145 |
| Number of cars | 5 | 8 | 13 | 9 |
Calculate the median speed.
The median of the following data is 525. Find the values of x and y, if the total frequency is 100.
| Class interval | Frequency |
| 0 – 100 | 2 |
| 100 – 200 | 5 |
| 200 – 300 | x |
| 300 – 400 | 12 |
| 400 – 500 | 17 |
| 500 – 600 | 20 |
| 600 – 700 | y |
| 700 – 800 | 9 |
| 800 – 900 | 7 |
| 900 – 1000 | 4 |
Find the modal and median classes of the following distribution.
| Class | 0 – 20 | 20 – 40 | 40 – 60 | 60 – 80 | 80 – 100 |
| Frequency | 11 | 22 | 19 | 18 | 7 |
