Advertisements
Advertisements
प्रश्न
In the following data the median of the runs scored by 60 top batsmen of the world in one-day international cricket matches is 5000. Find the missing frequencies x and y.
| Runs scored | 2500 – 3500 | 3500 – 4500 | 4500 – 5500 | 5500 – 6500 | 6500 – 7500 | 7500 - 8500 |
| Number of batsman | 5 | x | y | 12 | 6 | 2 |
उत्तर
We prepare the cumulative frequency table, as shown below:
| Runs scored | Number of batsman `bb((f_i))` | Cumulative Frequency (cf) |
| 2500 – 3500 | 5 | 5 |
| 3500 – 4500 | x | 5 + x |
| 4500 – 5500 | y | 5 + x + y |
| 5500 – 6500 | 12 | 17 + x + y |
| 6500 – 7500 | 6 | 23 + x + y |
| 7500 – 8500 | 2 | 25 + x + y |
| Total | N = Σ𝑓𝑖 = 60 |
Let x and y be the missing frequencies of class intervals 3500 – 4500 respectively. Then,
25 + x + y = 60 ⇒ x + y = 35 ……(1)
Median is 5000, which lies in 4500 – 5500.
So, the median class is 4500 – 5500.
∴ l = 4500, h = 1000, N = 60, f = y and cf = 5 + x
Now,
Median, `"M" = "i" + (("N"/2−"cf")/"f") × "h"`
`⇒ 5000 = 4500 + ((60/2 −(5+x))/ "y")× 1000`
`⇒ 5000 - 4500 = ((30−5−x)/"y") × 1000`
`⇒ 500 = ((25−x)/"y") × 1000`
⇒ y = 50 – 2x
⇒ 35 – x = 50 – 2x [From (1)]
⇒ 2x – x = 50 – 35
⇒ x = 15
∴ y = 35 – x
⇒ y = 35 – 15
⇒ y = 20
Hence, x = 15 and y = 20.
APPEARS IN
संबंधित प्रश्न
In a hospital, the ages of diabetic patients were recorded as follows. Find the median age.
| Age (in years) |
0 – 15 | 15 – 30 | 30 – 45 | 45 – 60 | 60 - 75 |
| No. of patients | 5 | 20 | 40 | 50 | 25 |
The following table shows the daily wages of workers in a factory:
| Daily wages in (Rs) | 0 – 100 | 100 – 200 | 200 – 300 | 300 – 400 | 400 – 500 |
| Number of workers | 40 | 32 | 48 | 22 | 8 |
Find the median daily wage income of the workers.
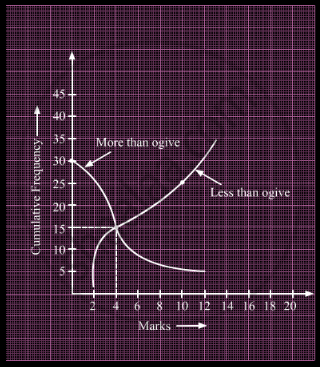
What is the value of the median of the data using the graph in the following figure of less than ogive and more than ogive?

The median of first 10 prime numbers is
The arithmetic mean and mode of a data are 24 and 12 respectively, then its median is
If 35 is removed from the data: 30, 34, 35, 36, 37, 38, 39, 40, then the median increased by
Calculate the median of the following distribution:
| Weight (in nearest kg.) | No. of students |
| 46 | 7 |
| 48 | 5 |
| 50 | 8 |
| 52 | 12 |
| 53 | 10 |
| 54 | 2 |
| 55 | 1 |
Find the median of the following frequency distribution:
| Class: | 0 – 20 | 20 – 40 | 40 – 60 | 60 – 80 | 80 – 100 |
| Frequency: | 6 | 8 | 5 | 9 | 7 |
Read the following passage and answer the questions given below.
|
Electric buses are becoming popular nowadays. These buses have the electricity stored in a battery. Electric buses have a range of approximately 280 km with just charge. These buses are superior to diesel buses as they reduce brake wear and also reduce pollution. 'transport department of a city wants to buy some electric buses for the city. So, the department wants to know the distance travelled by existing public transport buses in a day. The following data shows the distance travelled by 50 existing public transport buses in a day.
|
| Daily distance travelled (in km) | 100 – 120 | 120 – 140 | 140 – 160 | 160 – 180 | 180 – 200 |
| Number of buses | 12 | 14 | 8 | 6 | 10 |
- Find the 'median' distance travelled by a bus.
- Find the 'mean (average)' distance travelled by a bus.
The following table gives the monthly consumption of electricity of 100 families:
| Monthly Consumption (in units) |
130 – 140 | 140 – 150 | 150 – 160 | 160 – 170 | 170 – 180 | 180 – 190 | 190 – 200 |
| Number of families |
5 | 9 | 17 | 28 | 24 | 10 | 7 |
Find the median of the above data.

