Advertisements
Advertisements
प्रश्न
The median of the following data is 16. Find the missing frequencies a and b if the total of frequencies is 70.
| Class | 0 – 5 | 5 – 10 | 10 – 15 | 15 – 20 | 20 – 25 | 25 – 30 | 30 – 35 | 35 – 40 |
| Frequency | 12 | a | 12 | 15 | b | 6 | 6 | 4 |
उत्तर
| Class | Frequency (f) | Cumulative Frequency (cf) |
| 0 – 5 | 12 | 12 |
| 5 – 10 | a | 12+a |
| 10 – 15 | 12 | 24+a |
| 15 – 20 | 15 | 39+a |
| 20 – 25 | b | 39+a+b |
| 25 – 30 | 6 | 45+a+b |
| 30 – 35 | 6 | 51+a+b |
| 35 – 40 | 4 | 55+a+b |
| Total | N = Σ𝑓𝑖 = 70 |
Let a and b be the missing frequencies of class intervals 5 – 10 and 20 – 25 respectively.
Then, 55 + a + b = 70⇒a +b=15 …..(1)
Median is 16, which lies in 15 – 20. So, the median class is 15 – 20.
∴ l = 15, h = 5, N = 70, f = 15 and cf = 24 + a
Now,
Median,` M = l + ((N/2−cf)/f) × h`
`⇒ 16 = 15 + ((70/2 −(24 + a))/ 15)× 5`
`⇒ 16 = 15 + ((35−24−a)/3)`
`⇒ 16 = 15 + ((11−a)/3)`
`⇒ 16 – 15 = (11−a)/3`
⇒ 1 × 3 = 11 – a
⇒ a = 11 – 3
⇒ a = 8
∴ b = 15 – a [From (1)]
⇒ b = 15 – 8
⇒ b = 7
Hence, a = 8 and b = 7.
APPEARS IN
संबंधित प्रश्न
Compute the median for the following data:
| Marks | No. of students |
| More than 150 | 0 |
| More than 140 | 12 |
| More than 130 | 27 |
| More than 120 | 60 |
| More than 110 | 105 |
| More than 100 | 124 |
| More than 90 | 141 |
| More than 80 | 150 |
If the median of the following frequency distribution is 32.5, find the values of `f_1 and f_2`.
| Class | 0 – 10 | 10 – 20 | 20 – 30 | 30 -40 | 40 – 50 | 50 – 60 | 60 – 70 | Total |
| Frequency | `f_1` |
5 |
9 | 12 | `f_2` | 3 | 2 | 40 |
A data has 25 observations arranged in a descending order. Which observation represents the median?
The following table shows the information regarding the milk collected from farmers on a milk collection centre and the content of fat in the milk, measured by a lactometer. Find the mode of fat content.
| Content of fat (%) | 2 - 3 | 3 - 4 | 4 - 5 | 5 - 6 | 6 - 7 |
| Milk collected (Litre) | 30 | 70 | 80 | 60 | 20 |
The following frequency distribution table gives the ages of 200 patients treated in a hospital in a week. Find the mode of ages of the patients.
| Age (years) | Less than 5 | 5 - 9 | 10 - 14 | 15 - 19 | 20 - 24 | 25 - 29 |
| No. of patients | 38 | 32 | 50 | 36 | 24 | 20 |
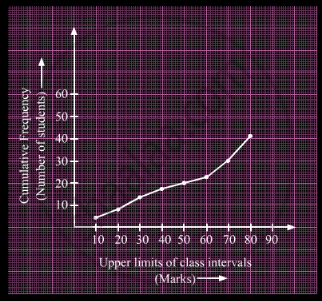
A student draws a cumulative frequency curve for the marks obtained by 40 students of a class as shown below. Find the median marks obtained by the students of the class.

If the median of the data: 6, 7, x − 2, x, 17, 20, written in ascending order, is 16. Then x=
The arithmetic mean and mode of a data are 24 and 12 respectively, then its median is
Calculate the median of marks of students for the following distribution:
| Marks | Number of students |
| More than or equal to 0 | 100 |
| More than or equal to 10 | 93 |
| More than or equal to 20 | 88 |
| More than or equal to 30 | 70 |
| More than or equal to 40 | 59 |
| More than or equal to 50 | 42 |
| More than or equal to 60 | 34 |
| More than or equal to 70 | 20 |
| More than or equal to 80 | 11 |
| More than or equal to 90 | 4 |
Heights of 50 students of class X of a school are recorded and following data is obtained:
| Height (in cm) | 130 – 135 | 135 – 140 | 140 – 145 | 145 – 150 | 150 – 155 | 155 – 160 |
| Number of students | 4 | 11 | 12 | 7 | 10 | 6 |
Find the median height of the students.
